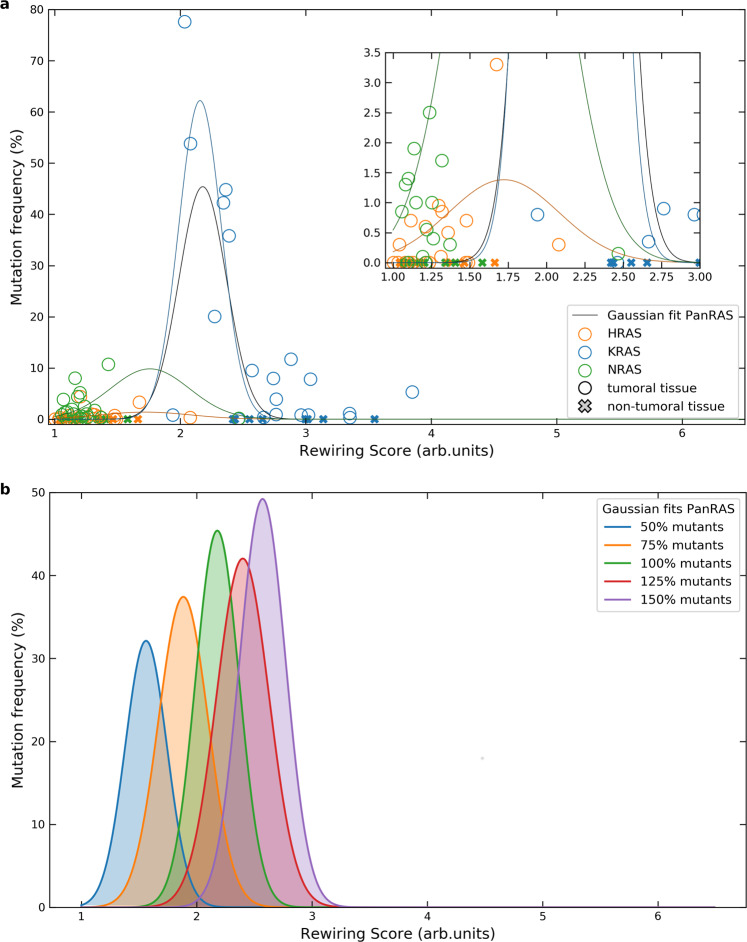
Fig. 6. Analysis of the relation between isoform-specific network rewiring and mutation frequencies for different mutant levels.
a Data points and fits are calculated for Ras isoform mutants with a 100% GTP load. Gaussian interpolations on both Ras isoform-specific and PanRas-general data are traced in solid lines (respectively, blue, orange, and green, for H-, K-, and NRAS; black for all the dataset). Each fit is performed excluding the tissues which rarely are associated with cancer (see main text); the corresponding data points are indicated with cross markers. The parameters for the Gaussian fits, for H-, K-, N-, and PanRAS are, respectively: mean of 1.72, 2.15, 1.76, and 2.18, and standard deviation of 0.36, 0.17, 0.32, and 0.19. b Mutation frequency vs. network rewiring score for varying level of Ras isoform mutants (from 50% to 150%). Gaussian fits are performed on PanRas data points. Parameters for the fits (from left to right) are the following – means: 1.56, 1.89, 2.18, 2.4, 2.57; standard deviations: 0.18, 0.21, 0.19, 0.22, 0.2.

