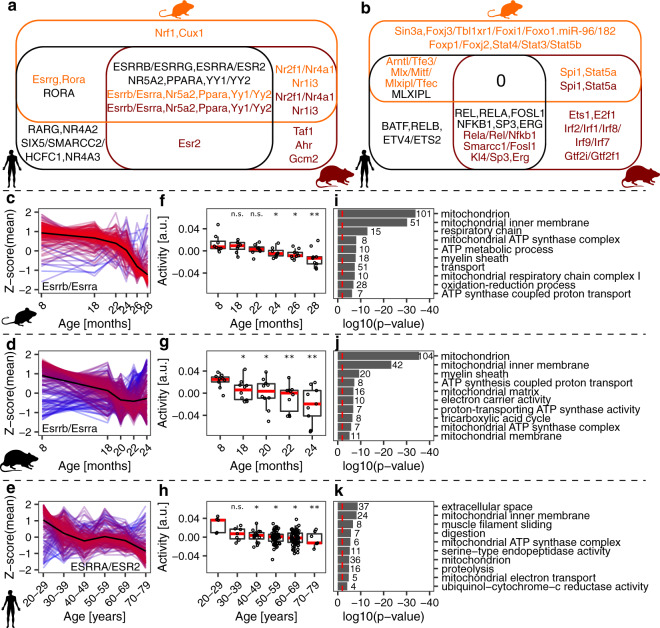
Fig. 6. ISMARA-inferred39 activity of transcription factors (TFs) and miRNAs during muscle aging.
a Venn diagram of motifs associated with TFs and miRNAs whose targets were downregulated during muscle aging. b Venn diagram of motifs associated with TFs and miRNAs whose targets were upregulated during muscle aging. Names of TFs and miRNAs are color-coded with respect to species: orange—mouse, brown—rat, black—human. c–e The normalized expression (z-scores of mean log2(TPMs)) of the top 300 target genes of motifs Esrrb/Esrra, Esrrb/Essra, and ESRRA/ESR2 in mouse, rat, and human, respectively. The mean value per age (or age group) across genes is indicated by the black (reference) line. Gene expression time course lines were colored by the distance from the reference line: red- close to the reference line, blue- far from the reference line. f–h Activity of motifs associated with TFs Esrrb/Esrra, Esrrb/Essra and ESRRA/ESR2 in mouse, rat, and human, respectively, predicted by ISMARA. *, ** and *** denote a significant difference based on two-sided Student’s t-test between the youngest age/age group and all other ages/age groups with p-value < 0.05, p-value < 0.01 and p-value < 0.001, respectively; “n.s.” not significant (p-value ≥ 0.05). i–k The 10 most enriched GO terms for the top 300 target genes of the TFs, i.e., genes depicted in (c–e). GO analysis was performed in DAVID87. Red dashed lines indicate the significance threshold (p-value < 0.01). The numbers next to the bars denote how many genes were attributed to an enriched GO term.

