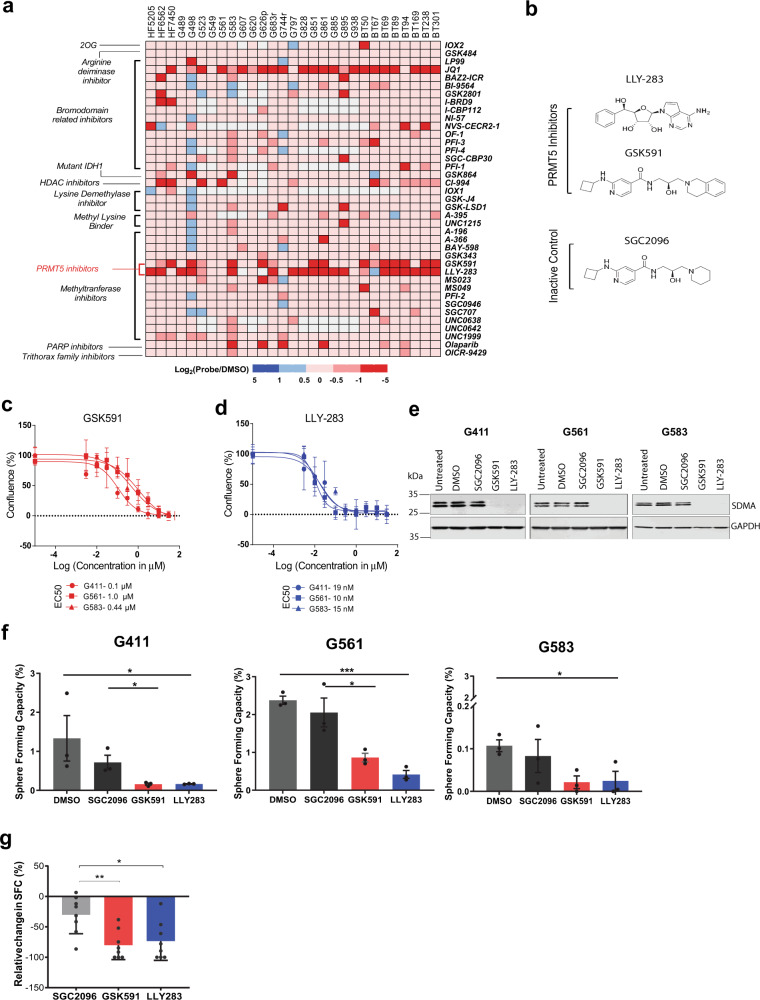
Fig. 1. Small molecule inhibition of PRMT5 impairs both proliferation and self-renewal in GSCs.
a Cell confluence heatmap of small molecule epigenetic screen showing significant inhibition of GSC proliferation by PRMT5 inhibitors. The screen was performed on 26 GSC lines and 3 control cell lines against 39 epigenetic chemical probes at 1 μM final concentration. Cells were grown adherently for 12–14 days and scored for confluence using high-throughput live-cell imaging. Data are represented as log2 (confluence with probe/confluence with DMSO). Red squares indicate decrease in cell confluence and blue squares indicate increase in confluence relative to vehicle. White squares indicate probe and cell line combinations that were not screened. b Chemical structures of the PRMT5 inhibitors, GSK591 and LLY-283, alongside the inactive control, SGC2096. c, d Percentage confluence of three GSC lines upon treatment with GSK591 (c—red) and LLY-283 (d—blue), with doses ranging from 3 nM to 30 μM. Dose response is calculated after 9–12 days of treatment with inhibitors/controls (until control wells are confluent). Data shown are representative of three independent experiments, mean ± SD. e Western blots of the SDMA mark on the SmB/B’ protein in three representative GSC lines G411, G561, and G583 following 5-day treatment with 1 μM of GSK591, LLY-283, SGC2096, or DMSO control. The western blot experiments were reproduced at least three independent times using cell lysates from different biological replicates. f Limiting dilution analysis (LDA) performed on three GSC lines treated with 1 μM of the PRMT5 inhibitors, GSK591 and LLY-283, and controls, SGC2096 and DMSO, for 14 days. Data show the percentage of sphere-forming capacity. n = 3 biologically independent samples, mean ± SEM. Two-tailed Unpaired t test, p values: G411-GSK/SGC = 0.0396, G561-LLY/DMSO = 0.0002, G561-GSK/SGC = 0.0400, G583-LLY/DMSO = 0.0350, G583-GSK/SGC = 0.2127. g Summary of limiting dilution analysis (LDA) performed on freshly dissociated GBM cells from 9 patients treated with 1 μM of the PRMT5 inhibitors, GSK591 and LLY-283, and controls, SGC2096 and DMSO, for 21 days. The y-axis shows the percentage relative change in sphere-forming capacity (normalized to DMSO). N = 9 biologically independent patient-derived GBM samples, mean ± SEM, individual data per sample are shown in Supplementary Fig. 1f. Two-tailed unpaired t test with Welch’s correction. p values: LLY283/SGC2096 = 0.0157, GSK591/SGC2096 = 0.0031. *p < 0.05; **p < 0.01; ***p < 0.001. Source data are provided as a Source data file.

