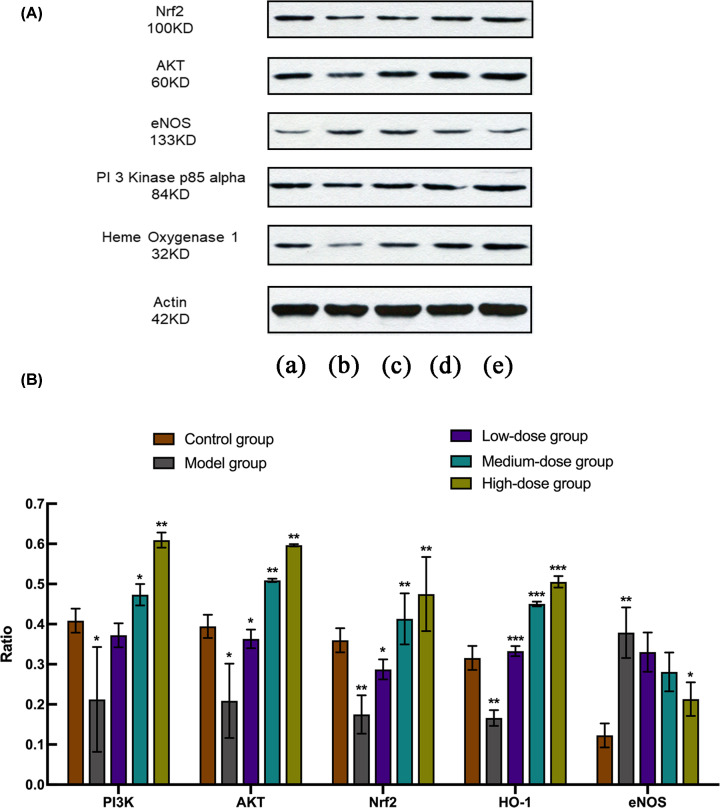
Figure 8. The expression analysis of PI3K, AKT, Nrf2, HO-1, eNOS detected by Western blot.
(A) The results of Western blot. (B) The relative protein expression of PI3K, AKT, Nrf2, HO-1and eNOS. t test, *P<0.05, **P<0.01, ***P<0.001 vs the model group. (a) Control group. (b) Model group. (c) Low-dose group. (d) Medium-dose group. (e) High-dose group.

