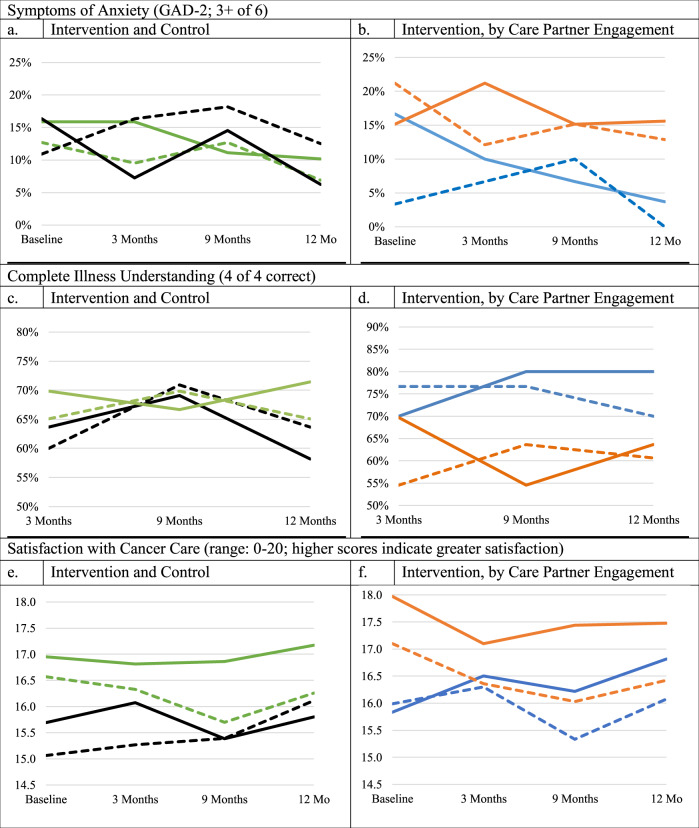
Fig. 2. Between group differences in patient and care partner-reported outcomes.
a, c, e Solid black line—Control Patient Dashed black line—Control Care Partner. Solid green line—Intervention Patient. Dashed green line—Intervention Care Partner. b, d, f Solid blue line—Patient with Engaged Care Partner. Dashed blue line—Engaged Care Partner. Solid orange line—Patient without Engaged Care Partner. Dashed orange line—Nonengaged Care Partner. Symptoms of anxiety refer to a cutpoint of 3+ on the GAD-2. Illness understanding ranges from 0 to 4 with higher scores indicating greater illness understanding: we compare participants with ratings of “4”, reflecting “complete illness understanding” with all others. Satisfaction with cancer care is measured using the FAMCARE (range: 0–20) with higher scores reflecting greater satisfaction. Intervention versus control group outcomes: N = 118 (n = 63 intervention, n = 55 control). Intervention group outcomes, stratified by whether the care partner accessed MyChart: N = 63 (n = 30 with an engaged care partner, n = 33 without engaged care partner).

