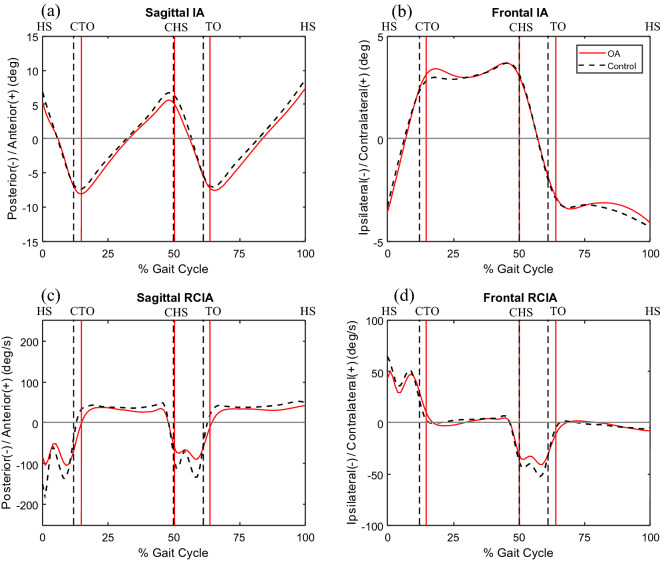
Figure 2.
Mean curves of the COM–COP inclination angles (IA) and their rates of change (RCIA) in the sagittal (a,c) and frontal (b,d) planes for the knee osteoarthritis group and the control group during level walking. Gait events, namely heel-strike (HS), contralateral toe-off (CTO), contralateral heel-strike (CHS) and toe-off (TO), are indicated by vertical lines. Positive sagittal and frontal IA indicate COM positions that are anterior and contralateral to the COP, respectively. Positive sagittal and frontal RCIA indicate rates of anterior changes and contralateral changes in the corresponding IA, respectively.

