Figure 6.

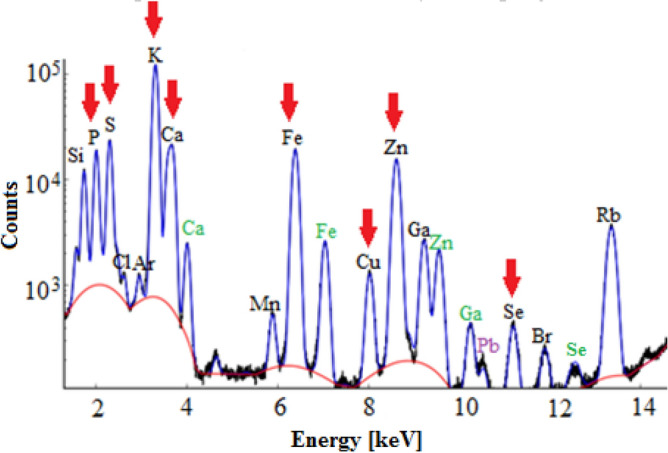
An example of X-ray fluorescence spectrum registered for liver sample. Kα, Kβ and L spectral lines were marked with black, green and purple colours, respectively. Lines of the analysed elements were marked with red arrows.

An example of X-ray fluorescence spectrum registered for liver sample. Kα, Kβ and L spectral lines were marked with black, green and purple colours, respectively. Lines of the analysed elements were marked with red arrows.