
Figure 5.
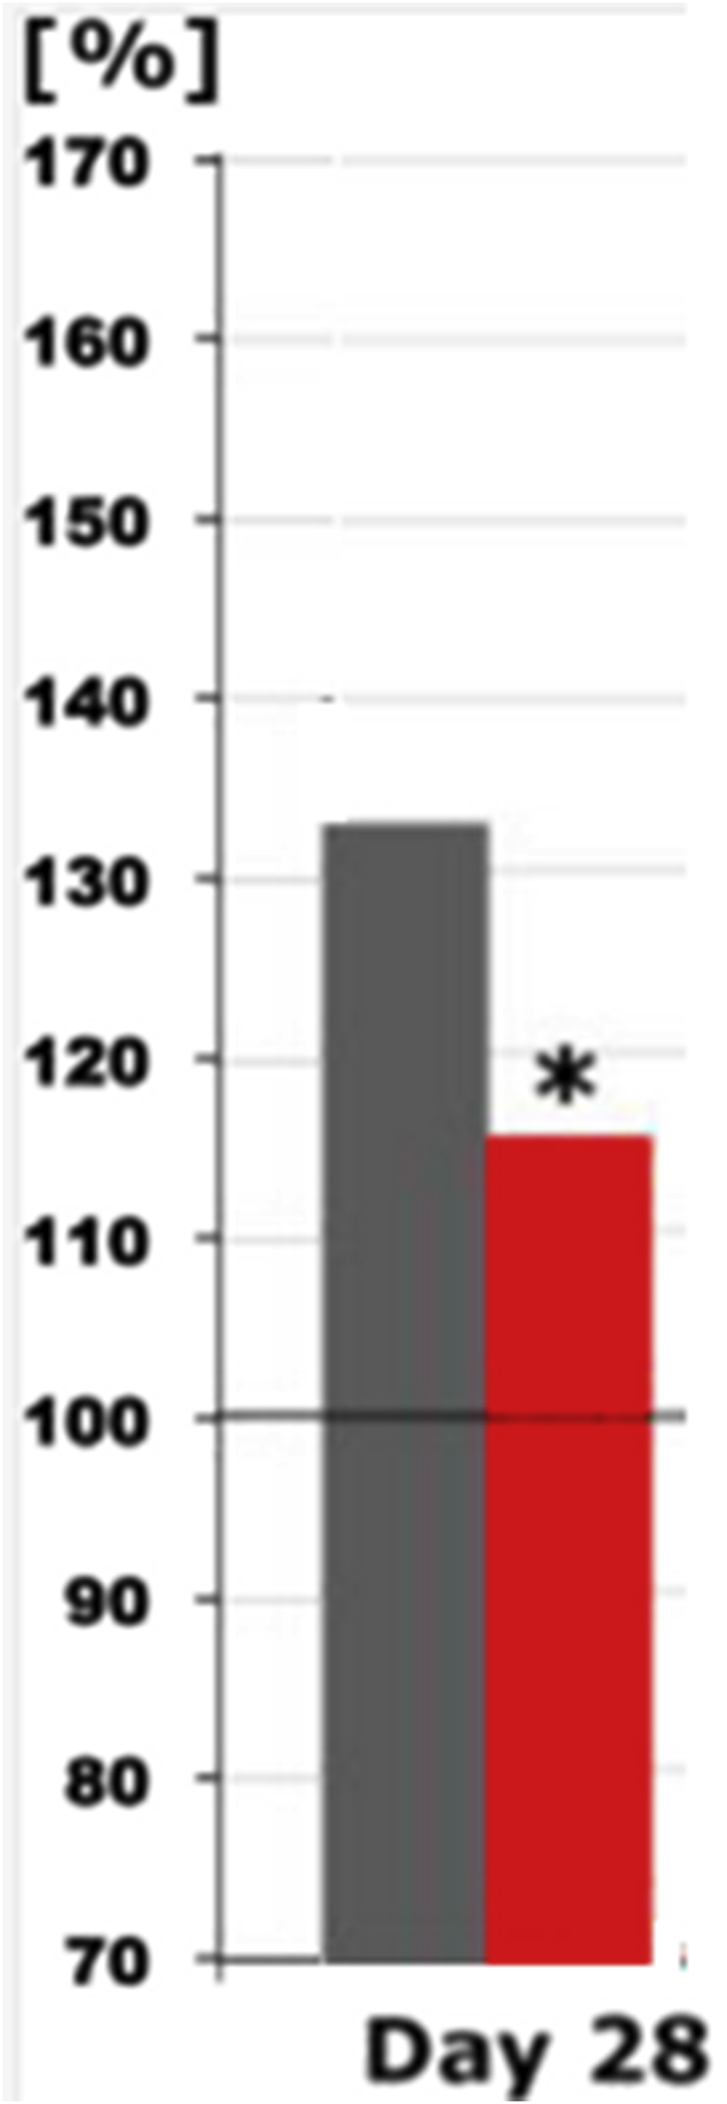
Beta 2 spectral power differences under the recording condition “eyes open” on day 28 in the presence of placebo (grey) or Salvia off. (red) with respect to F3/4/7/8 electrodes (one sided t-test). The spectral power (between 70 and 170% on the ordinate of the bar graph) is plotted against the pre-drug value (at baseline set to 100%), thus reflecting the effect of placebo or Salvia off.