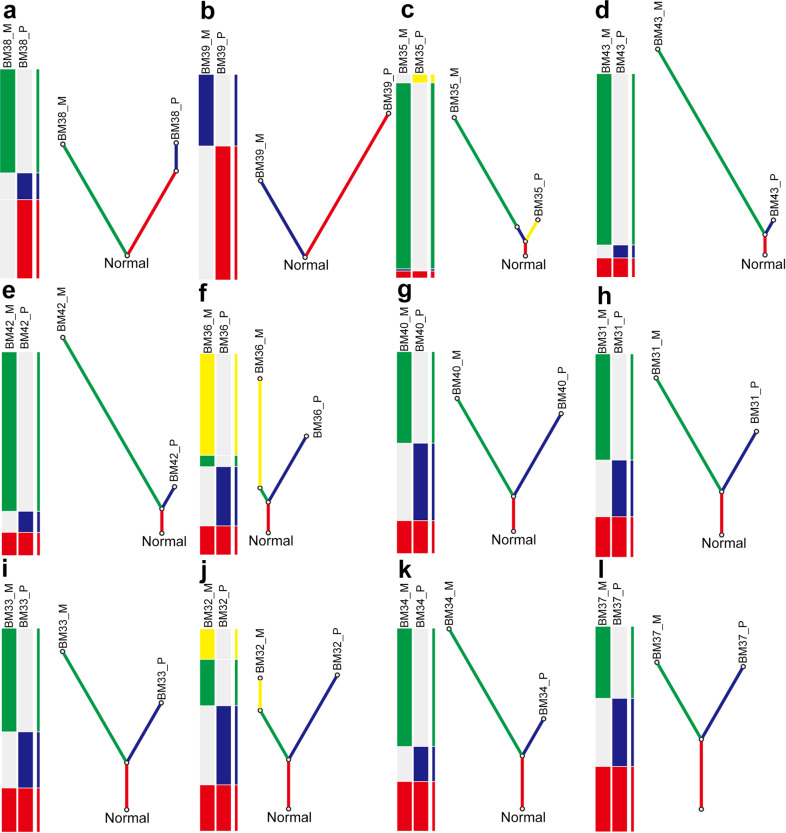
Fig. 3. Phylogenetic analysis of cases with brain metastases.
a–l phylogenetic tree of BM38, BM39, BM35, BM43, BM42, BM36, BM40, BM31, BM33, BM32, BM34, and BM37. For each panel, heatplot with different bars represents various distributions of identified mutations including somatic SNVs and CNVs. Fraction of ubiquitous identified mutations (trunk) and unique identified mutations (branch) reveal the phylogenetic relationship of BM_P and BM_M within a single case. BM_P primary lesion, BM_M brain metastatic lesion.

