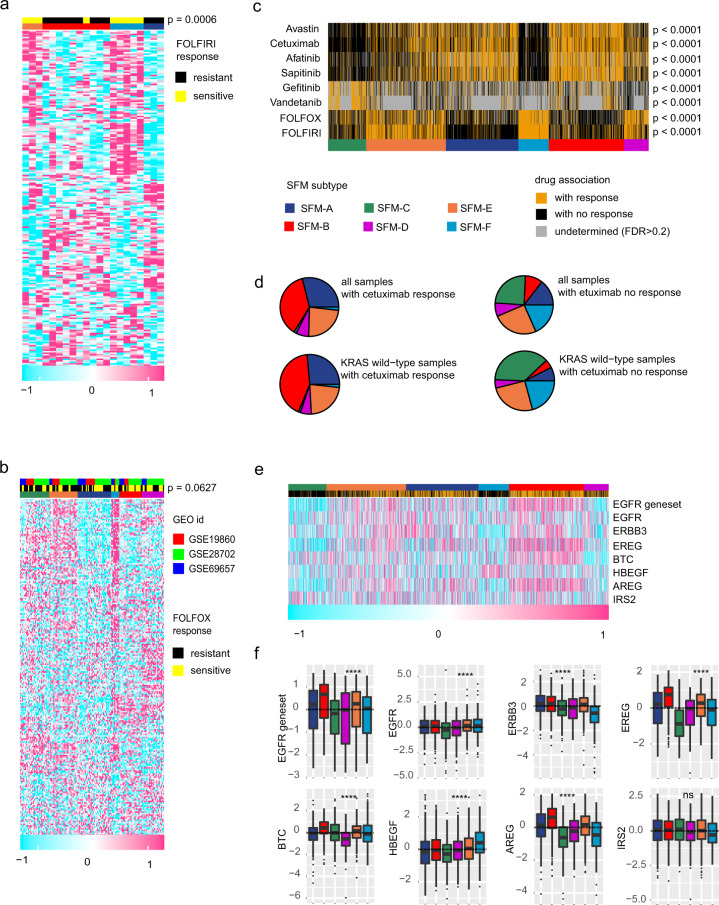
Fig. 2. Distinct sensitivity among SFM subtypes to FOLFIRI and FOLFOX chemotherapy regimens and RGFR inhibitors.
a Heatmap showing individual response of patients to FOLFIRI and their association with subtypes in GSE62080 dataset (n = 21). P value was calculated using Chi-squared test. b Heatmap showing individual responses of patients to FOLFOX and their association with subtypes in combined three GEO datasets (GSE19860, GSE28702, and GSE69657, n = 142). P value was calculated using Chi-squared test. c Heatmap showing association of individual CRC patient’s response to FOLFIRI, FOLFOX, and EGFR inhibitors. In these analyses, samples with FDR < 0.2 were regarded as significant. d Prevalence of SFM subtypes regarded as sensitive or resistant to cetuximab in all CRC patients (n = 1752) or only in KRAS wild-type patients (n = 637). e Heatmap showing response to cetuximab, quantified expression of gene set of the EGFR pathway activity by applying GSVA and expression of individual genes of the EGFR gene set among SFM subtypes. f Box plots of the EGFR gene set and individual genes of the EGFR gene set among SFM subtypes. Box hinges represent first and third quartiles, and middle represents the median. The upper and lower whiskers extend from hinges up and down indicate the most extreme values that are within 1.5 × IQR (interquartile range) of the respective hinge.

