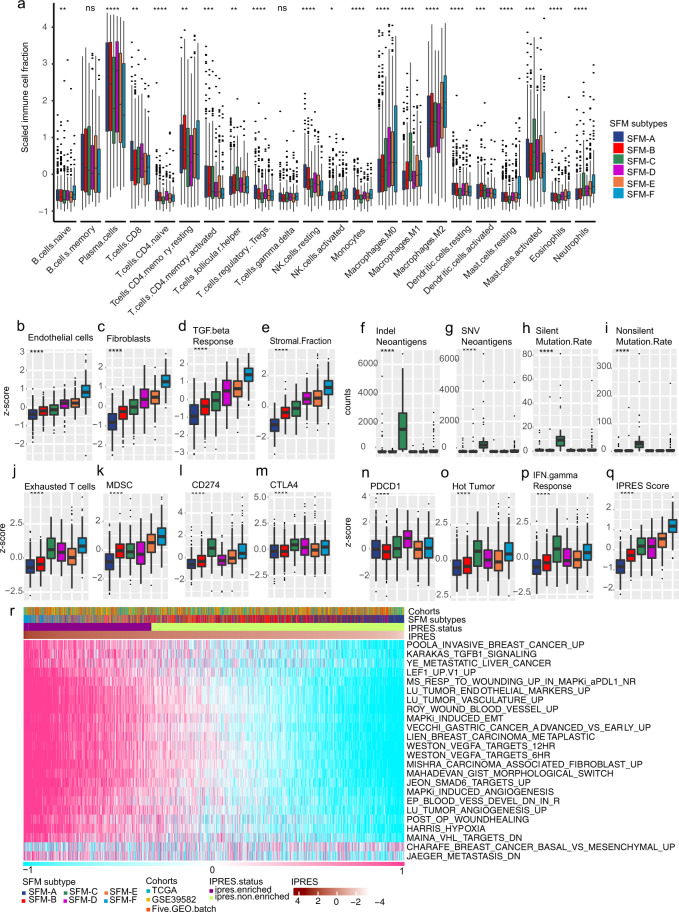
Fig. 3. Immune and TME-associated differences across SFM subtypes.
a Estimate immune cells filtration using CIBERSORT in aggregated dataset. The fraction of immune cells were plotted using box plot across SFM subtypes. Box plots of fractions of endothelial cells (b) and fibroblasts (c) by MCP-counter algorithm. TGF-β response score using GSVA (d), stromal fraction using ESTIMATE (e), neoantigen production (f, g), tumor mutation burden (h, i), proportion of exhausted cells (j), and MDSC (k) using GSVA, expression differences of checkpoint biomarkers, including CD274 (l), CTLA4 (m) and PDCD1 (n), hot tumor signature score (o), IFN-γresponse score (p), and IPRES score (q) using GSVA. r Estimate IPRES signature using GSVA. Cases were annotated as “IPRES enriched” when IPRES score were >0.35 unless were annotated as “IPRES non-enriched”. The statistical difference was examined usings the Kruskal–Wallis test. (ns, P > 0.05; *P < = 0.05; **P < = 0.01; ***P < = 0.001; ****P < = 0.0001). For a–q, box hinges represent first and third quartiles, and middle represents the median. The upper and lower whiskers extend from hinges up and down indicate the most extreme values that are within 1.5 × IQR (interquartile range) of the respective hinge.

