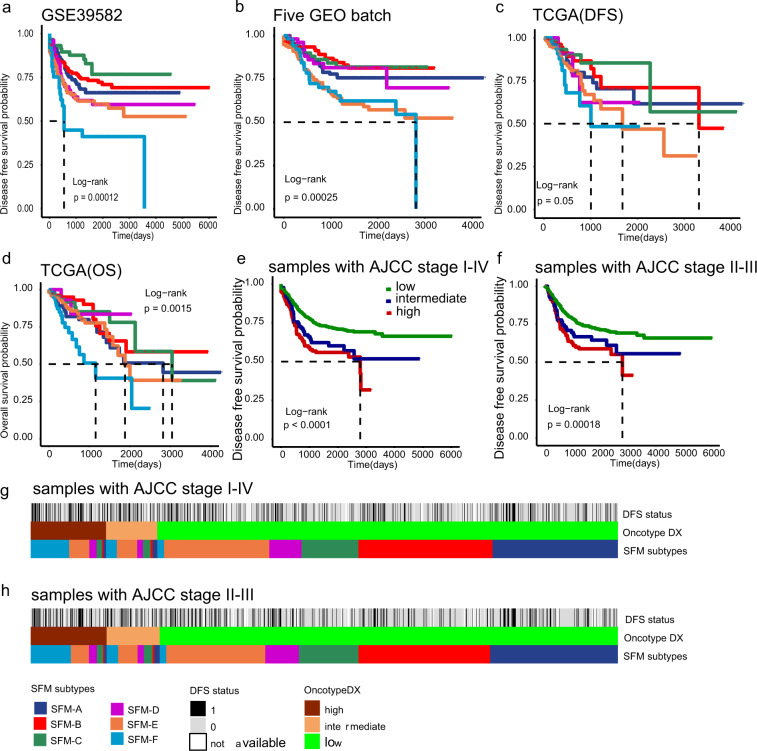
Fig. 4. Survival differences across SFM subtypes.
Kaplan–Meier plots of DFS and OS in training dataset (a, GSE39582) and validation dataset (b, five GEO batch; c, TCGA for DFS; and d, TCGA for OS). e Kaplan–Meier plots of Oncotype DX risk groups in stage I–IV cases. f Kaplan–Meier plots of Oncotype DX risk groups in stage II–III cases. The tick marks on the Kaplan–Meier curves indicated the censored patients. The differences between the curves were determined by the log-rank test. g Comparison of SFM subtypes and Oncotype DX classification in stage I–IV cases. h Comparison of SFM subtypes and Oncotype DX classification in stage II and III cases.

