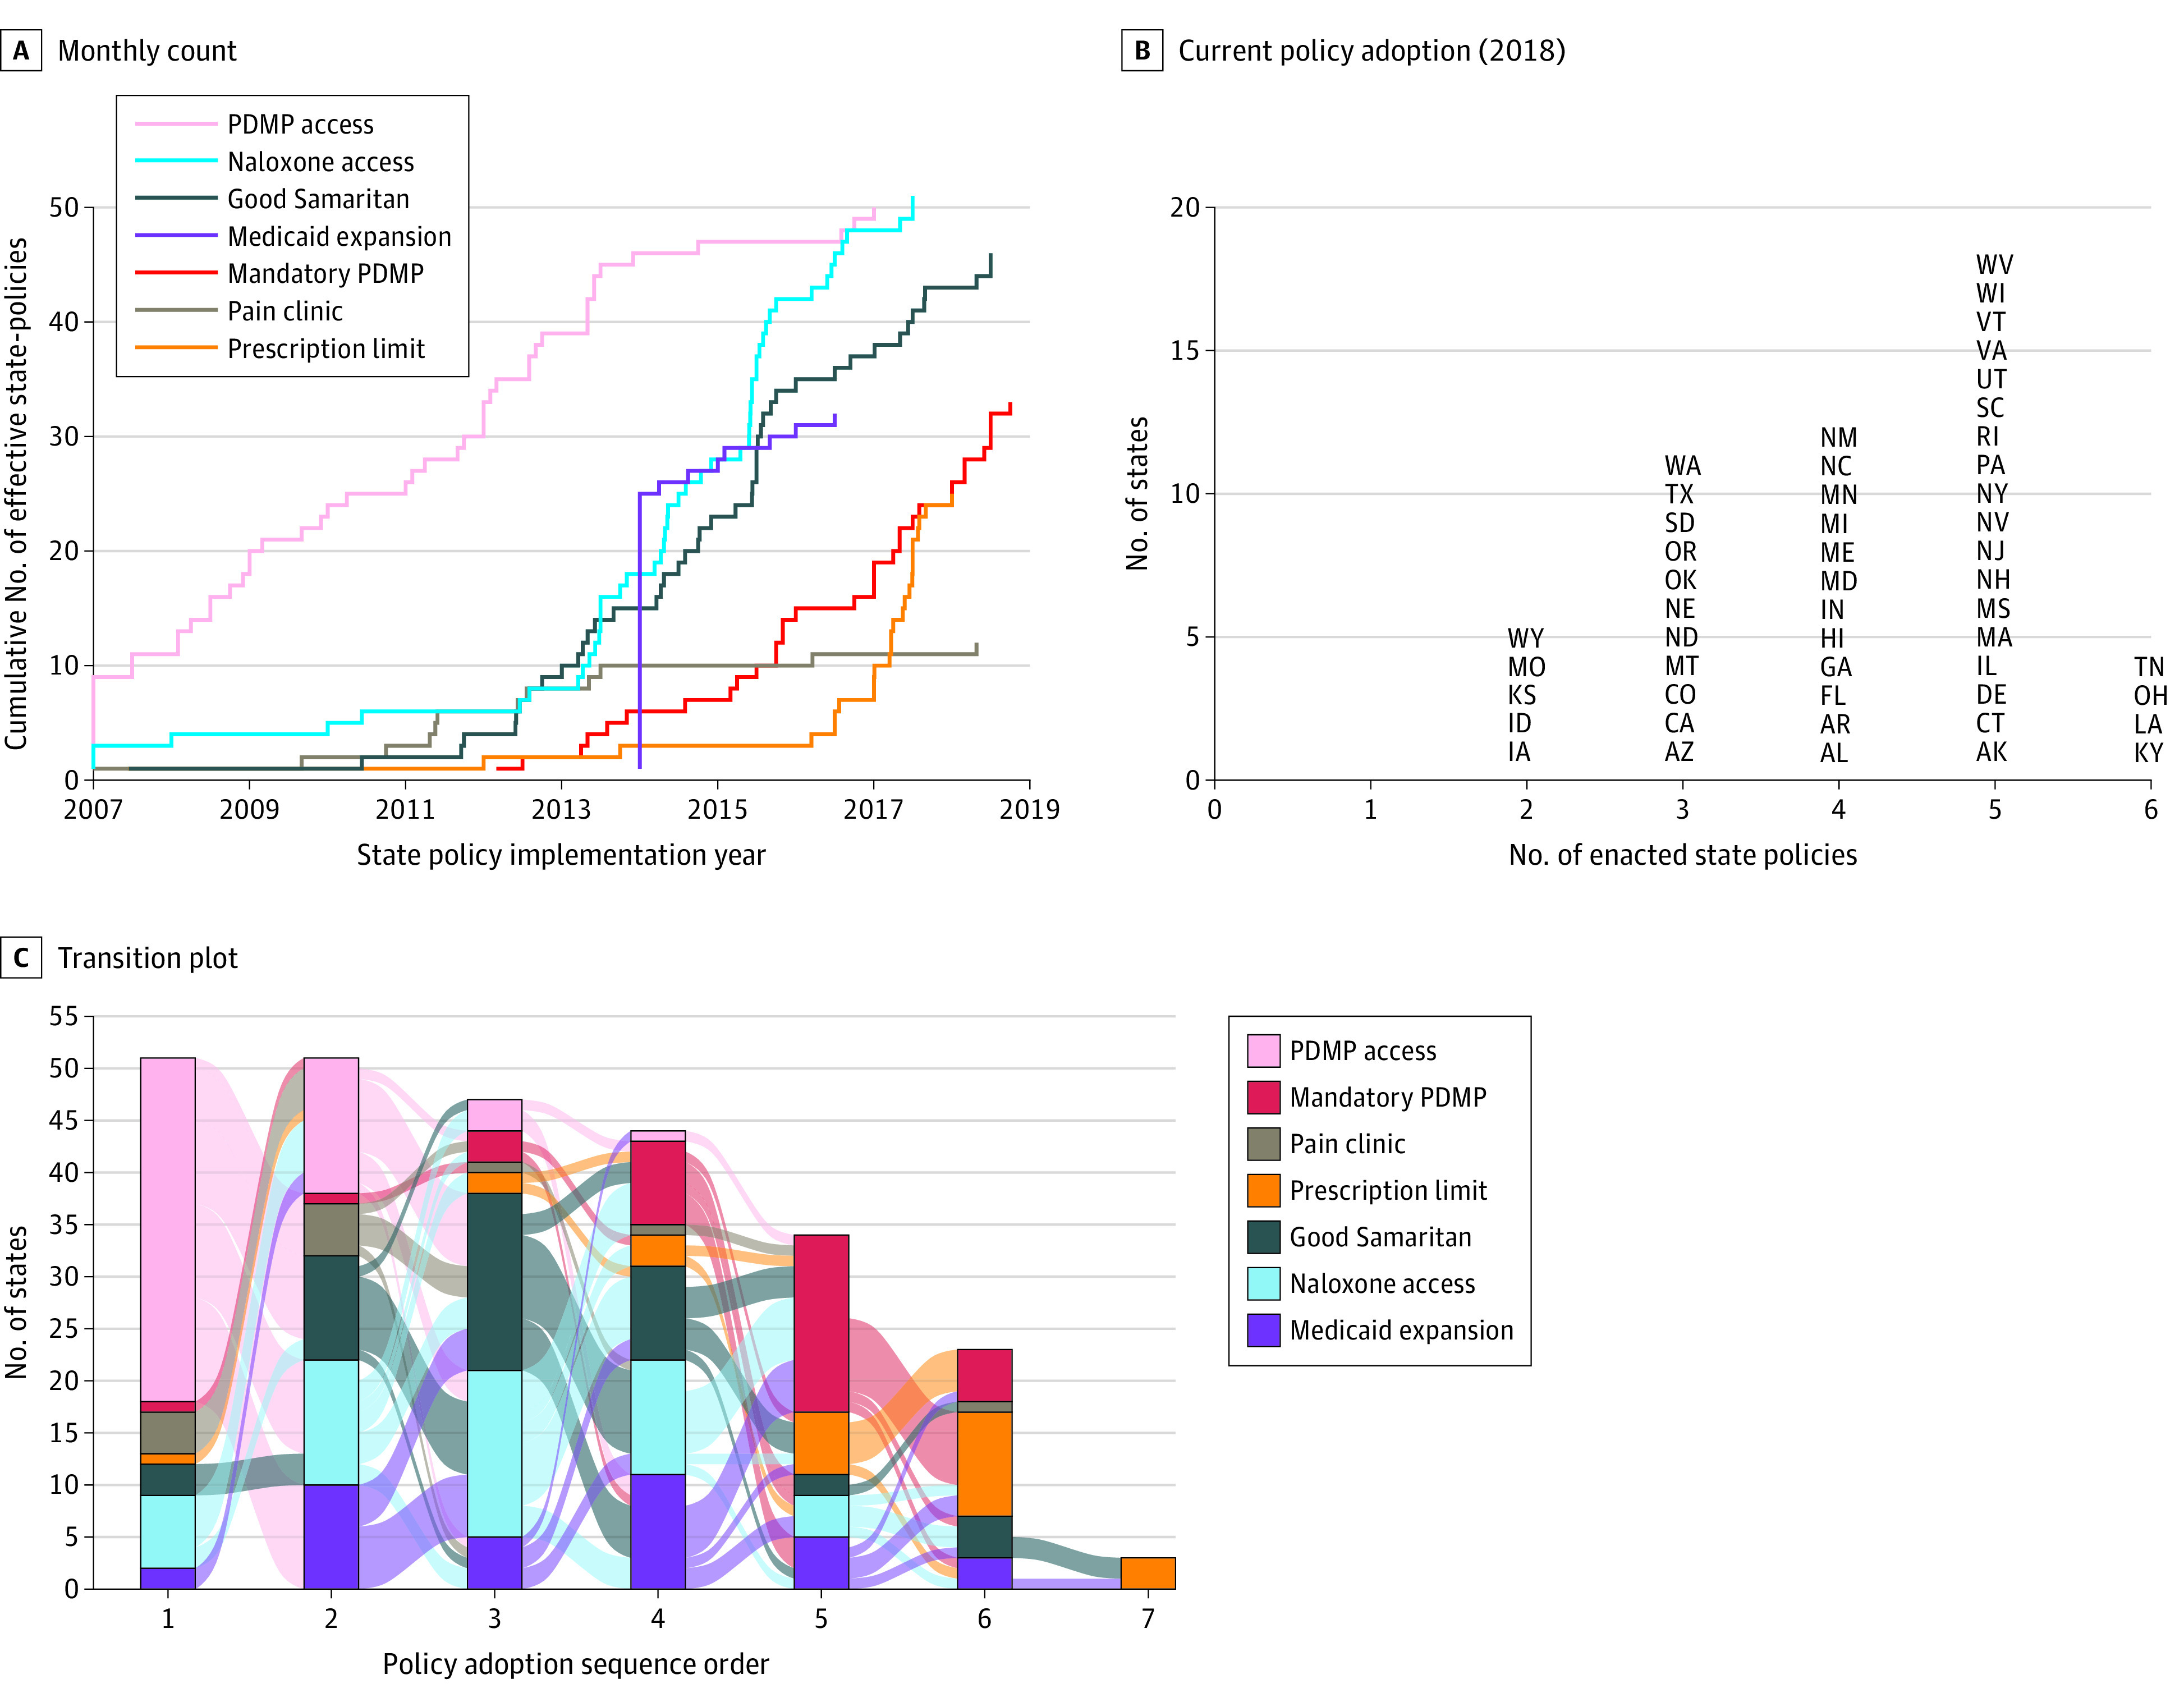
Figure 1. Implementation of State Policies From 2007 to 2018.

Figure shows the cumulative number of opioid-related state policies implemented, with Medicaid expansion included as a control (A), the number of enacted state policies as of 2018 (B), and the transition rate of the state policies (C). PDMP indicates prescription drug monitoring program.
