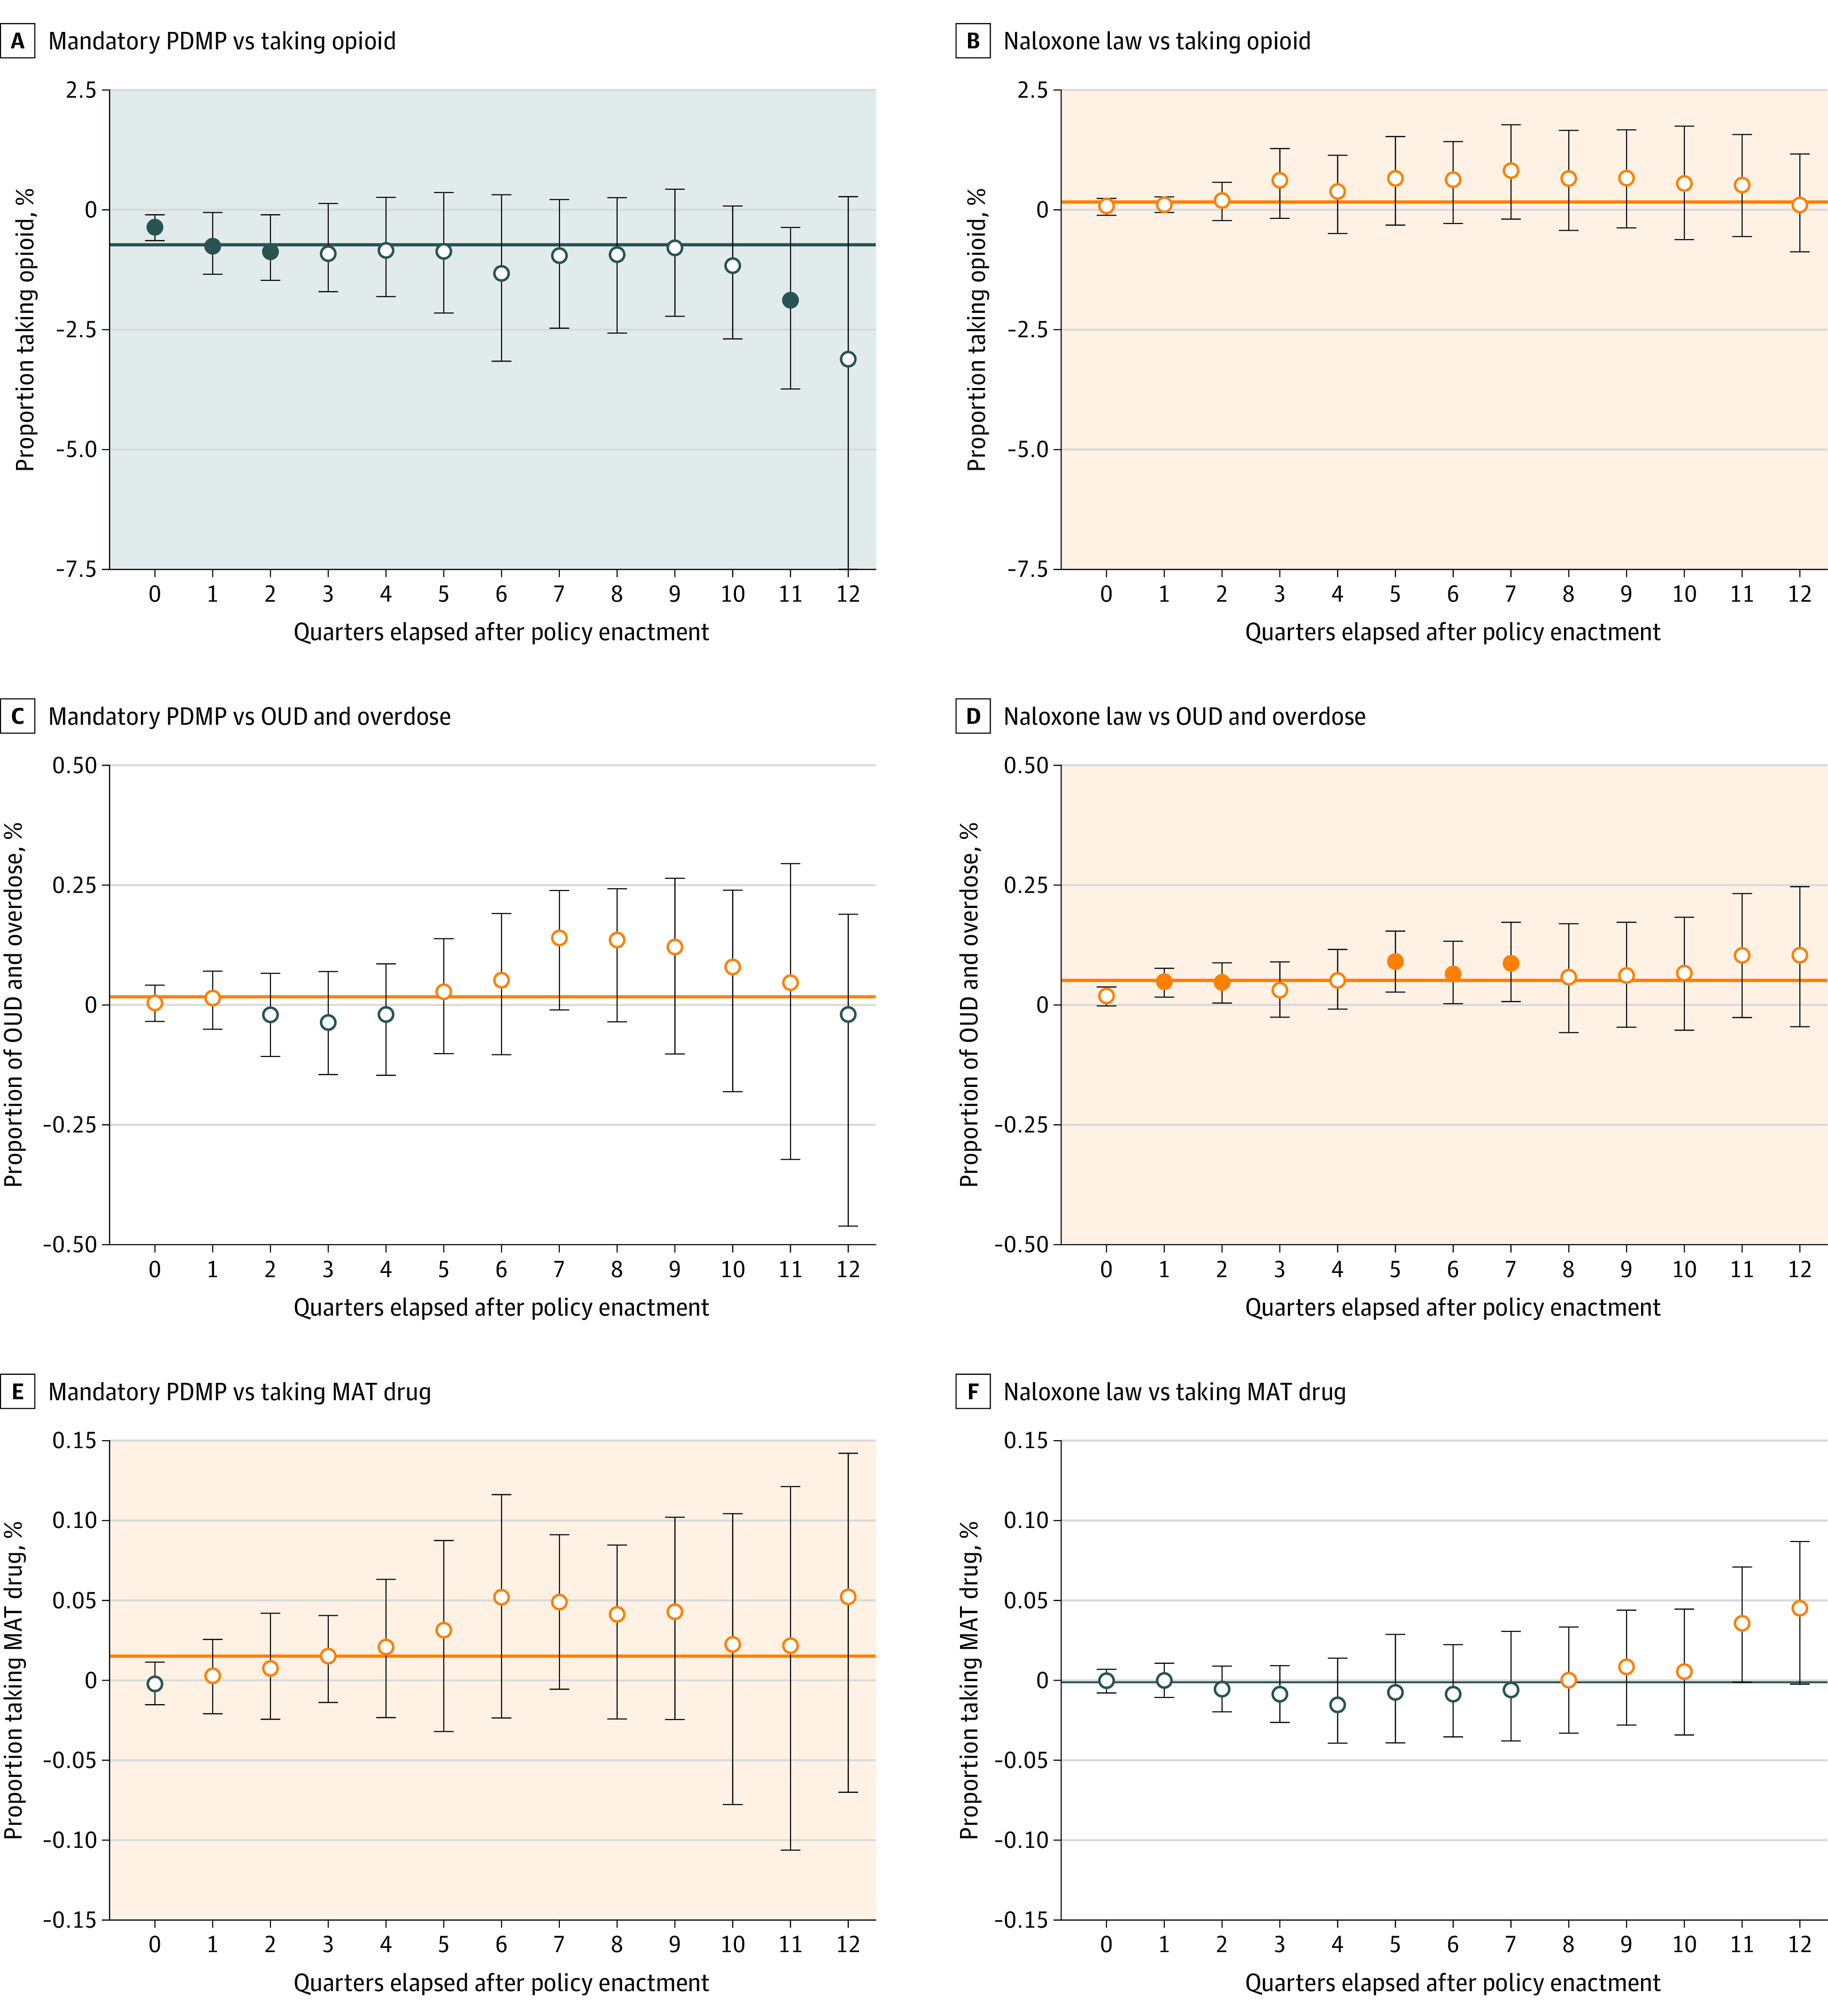
Figure 2. Association of Mandatory Prescription Drug Monitoring Program (PDMP) and Naloxone Law Implementation With Indicators of Prescription Opioid Misuse and Opioid Overdose in a Commercially Insured Population.

The error bars represent the 95% CIs, and the shaded backgrounds represent positive (orange) and negative (blue) associations. The solid horizontal line represents the estimated mean effect size across all quarterly effect sizes from random-effects meta-analysis models. Quarters are a period of three months. MAT indicates medication-assisted treatment; open circle, 95% CIs overlap with 0; OUD, opioid use disorder; solid circle, 95% CIs do not overlap with 0.
