
Figure 3.
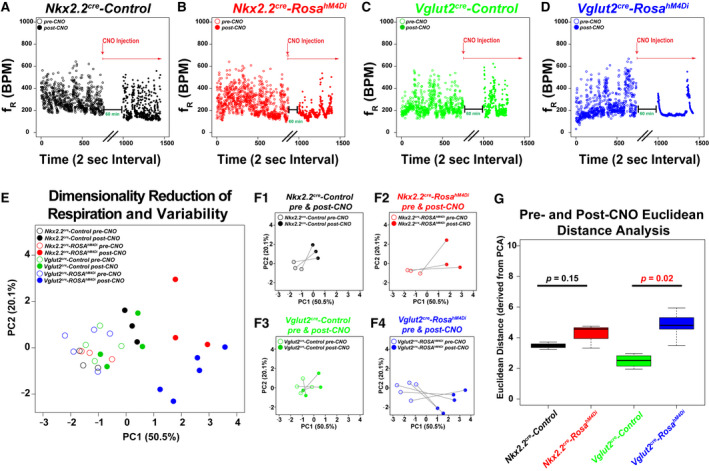
Respiratory Physiology of Nkx2.2Cre hM4Di inhibitory DREADD mice. A‐D. Dot plots show genotype on top, frequency on Y‐axis (breaths per minute), and time (2 sec bins) on X‐axis for sample animals before (open circle) and after (closed circle) i.p. injection of CNO (0.25 mg/kg). In each dot plot, the experimental paradigm is shown delineating the CNO treatment. Note that data were appended from pre and post‐CNO recordings and plotted continuously on the same graph for ease of representation (black parallel lines on X‐axis denote breaking of the continuous scale, with the post‐CNO recording arbitrarily beginning at x = 1000). Nkx2.2Cre, ROSA+/h4MDI animals are plotted in red for dot plots, PCA, and bar graphs, Nkx2.2Cre, Controls are plotted in black, Vglut2Cre, are plotted in green, and Vglut2Cre, ROSA+/h4MDI animals are plotted in blue. E. Principal component analysis of all of the ventilation data and respiration variability data derived from Poincaré analysis are graphed along PC1 (50.5% of variance) and PC2 (20.1% of variance). Color coded legend is in the top right for E‐F. F. For ease of representation, each group is graphed in isolation before and after CNO treatment along PC1 and PC2. F1 = Nkx2.2cre Control, F2 = Nkx2.2cre, ROSAh4MDi, F3 = Vglut2cre control, F4 = Vglut2cre, Rosah4MDi. G. The Euclidean distance along all of the principal components was calculated for each animal before and after CNO treatment, and then graphed as a box‐whisker plot based on genotype. Box plots show solid black line to represent the median, the box represents in the interquartile range, and the whiskers represent 1.5 times the interquartile range. P‐values of no significance are shown in the box plots in black font, with corrected P‐values of < 0.05 shown in red. For Nkx2.2 experiments, Nkx2.2Cre, ROSA+/h4MDI n = 3, control animals n = 3. For Vglut2 experiments, Vglut2Cre, ROSA+/h4MDI n = 4, control n = 5.