
Fig. 1. Standing breathing parameters cannot elucidate ages further in development.
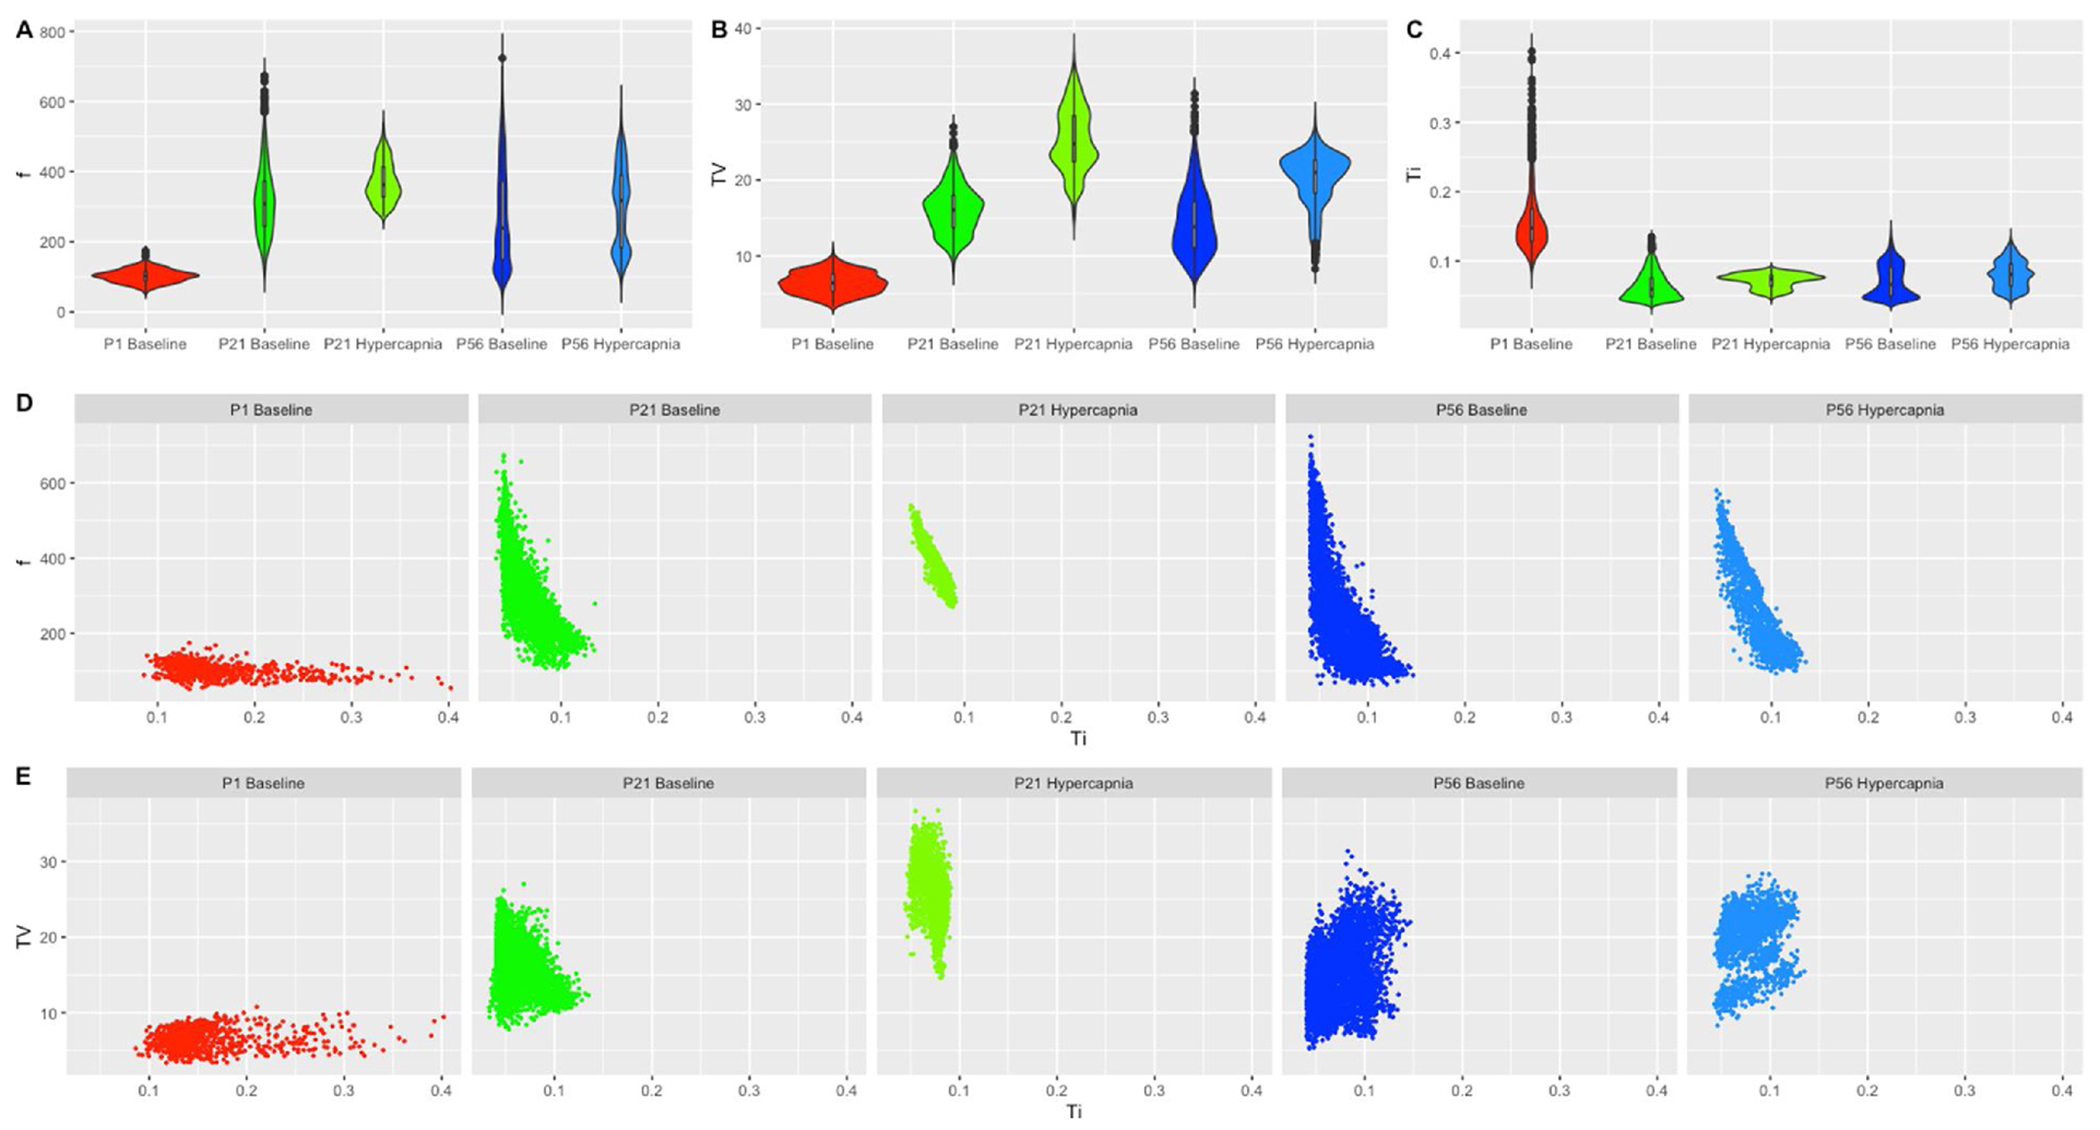
Violin plots of (A) breathing frequency (breaths/min), (B) tidal volume (mL/kg) (C) inspiratory time (sec) were generated in ggplot2 for P1 baseline breathing, P21 baseline breathing, P21 hypercapnic breathing, P56 baseline breathing and P56 hypercapnic breathing. Inspiratory time was then plotted as a relationship on the x-axis to either (D) breathing frequency on the y-axis or (E) tidal volume on the y-axis. All variables were plotted in the same x and y scale to appreciate data dispersion and shape. P1 hypercapnia was not included as mice could not be measured in the hypercapnic chamber.