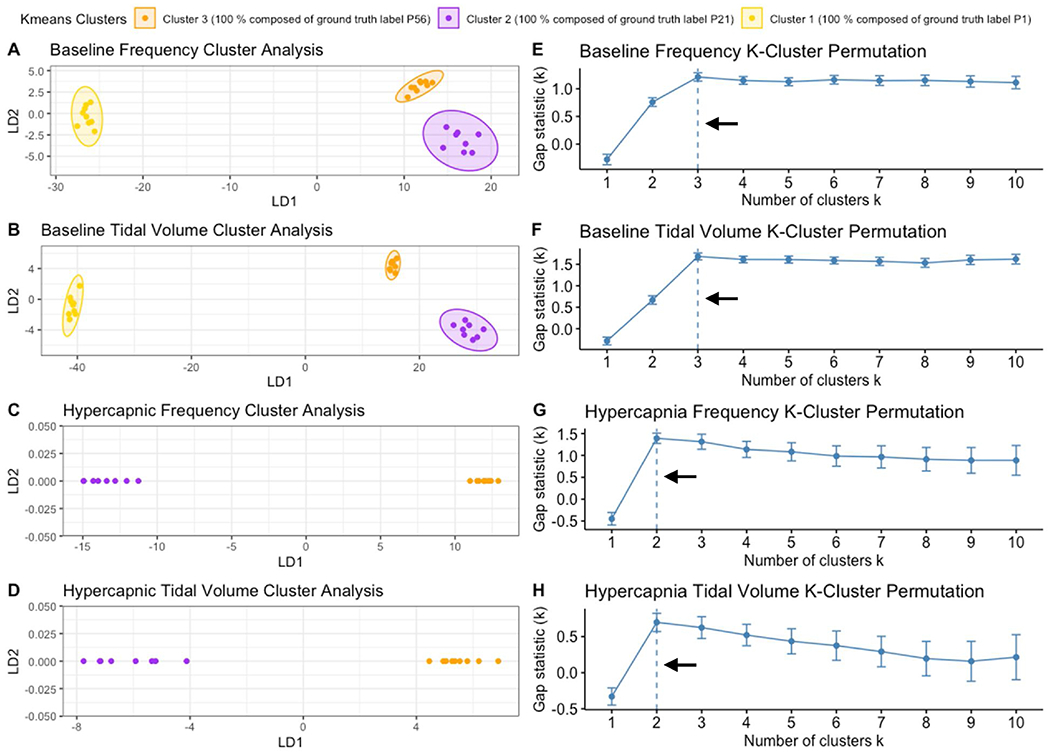
Fig. 13. Animals cluster based on parameter relationships and respiratory variations.

Kmeans cluster analysis was performed in R to create distinct clusters of animals independent of age labels to confirm if animals would cluster based on respiratory relationships and variation independent of age. Similar to LDA plots, baseline breathing among P1, P21 and P56 (A–B) and hypercapnic breathing between P21 and P56 (C–D) are shown with machine calculated clusters highlighted into 3/2 groups. Gap statistic analysis (E–H) was used to find the optimal number of clusters for each respective kmeans cluster analysis (A/E; B/F; C/G; D/H). Arrows indicate the optimal cluster number that was used for each plot.
