
Fig. 6. Respiratory peak expiratoiy flow (mL/sec) variation shows changes with age and breathing state.
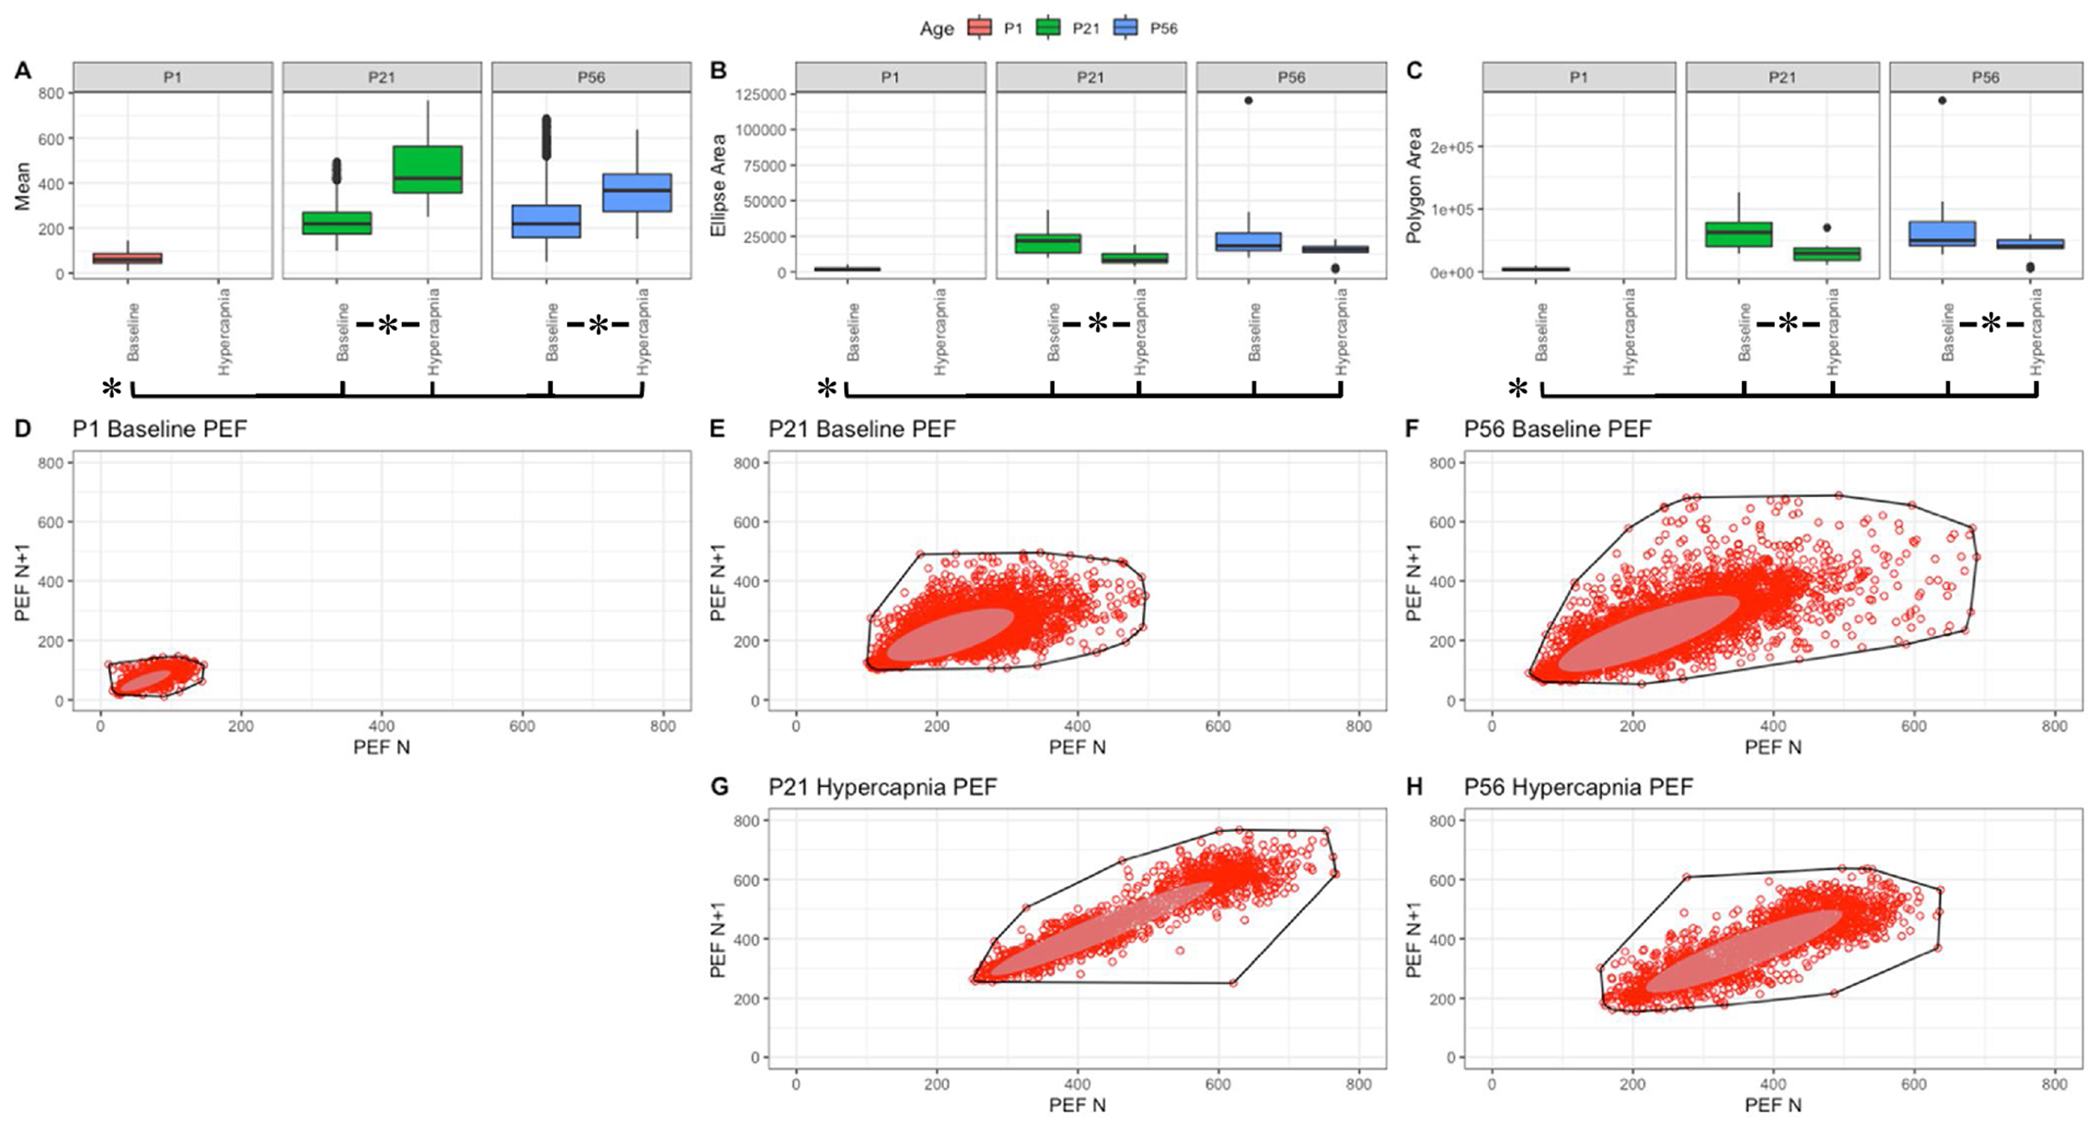
Parameter boxplots were generated to compare parameter mean (A), ellipse area (B) and polygon area (C) in P1, P21 and P56 in both baseline and hypercapnic states. P1 hypercapnia was omitted as previously mentioned in Fig. 1. Ellipse area was plotted as a confidence ellipse where center was the mean and the outer diameter contains 1 standard deviation of the dataset. Polygon areas were generated utilizing the extreme points which form the outer margin of each plot. Poincaré plots were generated from baseline breathing states (D–F) and hypercapnic states (G–H) to visualize variation in peak expiratory flow (PEF). T-tests were performed between age groups and breathing states for mean, polygon area and ellipse area. Bars and asterisks were utilized to represent significant variation between groups with p-values < 0.05.