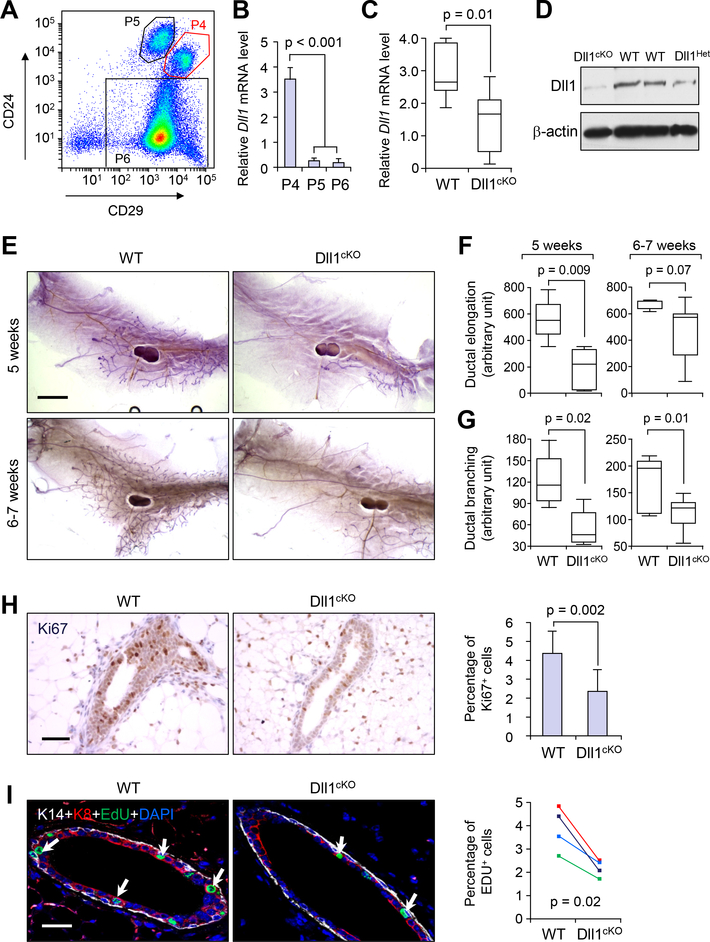
Fig. 1. Dll1 is required for mammary gland ductal morphogenesis.
(A) FACS profile of different populations of Lin− mammary epithelial cells based on staining of CD24 and CD29. (B) qRT-PCR analysis of Dll1 mRNA expression in different subpopulations of mammary epithelial cells as in (A). qRT-PCR values were normalized to the housekeeping gene Gapdh. n = 5 samples, experiments were performed three times, each with qRT-PCR in technical duplicate, and data are presented as the mean ± SD. * p < 0.001 by Student’s t-test. (C) qRT-PCR analysis of Dll1 mRNA expression in mammary epithelial cells from WT and Dll1 conditional knockout mice (Dll1cKO). The boxes represent the 75th, 50th and 25th percentile of the values. The top and bottom lines represent maximum and minimal data points within the 1.5x IQ (inter quarter) range, respectively. p-value of box plot in c was computed by Mann Whitney U test. n = 7 samples for WT and n = 9 samples for Dll1cKO in (C). (D) Western blot showing Dll1 protein expression in the mammary epithelial cells from WT and Dll1cKO mice. (E) Representative alum carmine stained whole mount mammary outgrowths from WT and Dll1cKO mice at 5 weeks and 6–7 weeks respectively. (F-G) Box plot analyses of ductal elongation and branching in WT and Dll1cKO mice. Quantification of ductal branching (tertiary branch points) was measured in defined area. The boxes represent the 75th, 50th and 25th percentile of the values. The top and bottom lines represent maximum and minimal data points within the 1.5x IQ (inter quarter) range, respectively. p-value computed by Mann-Whitney U test. n = 5 samples per genotype. (H) Ki67 staining in outgrowth sections from WT and Dll1cKO mice mammary gland sections (left panel). Quantification of Ki67+ cell percentage among total epithelial cells in field of view is shown (right panel). p-value was computed by Student’s t-test. n = 7 samples for WT and n = 5 samples for Dll1cKO. (I) Keratin-14 (K14), Keratin-8 (K8) and EdU staining of mammary gland sections of WT and Dll1cKO mice at 5–6 weeks age (left). White arrows indicate EdU+ cells in left panel. Quantification of EdU+ cell percentage among total epithelial cells in field of view is shown in the right panel. p-value computed by paired Student’s t-test as sibling cohorts of mice were used. n = 4 samples for each genotype in the left panel. Size bar, 2 mm in (E), 40 μm (H) and (I) respectively.

