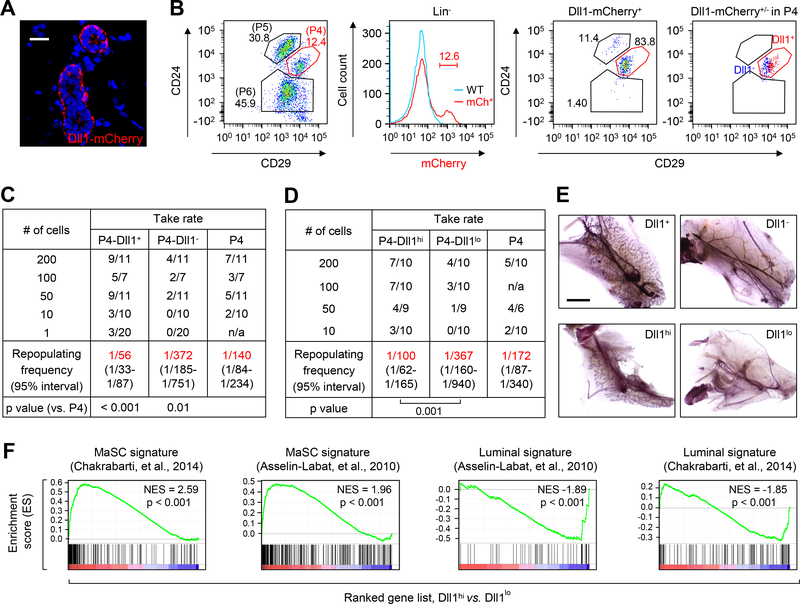
Fig. 3. Dll1+ population is enriched in cells with MaSC activity.
(A) Immunofluorescence image of Dll1-mCherry reporter mice mammary gland section stained with mCherry antibody. (B) Representative FACS profile of mammary epithelial cells from Dll1-mCherry reporter mice at 6 weeks of age based on staining with CD24 and CD29 (left panel). Middle panel: mCherry+ cells in lineage negative (Lin−) population. Right two panels: distribution of Dll1-mCherry+ cells in different epithelial populations (left), and Dll1-mCherry+ and Dll1-mCherry− cells in the P4 population (right). (C-D) Table showing reconstitution efficiency at limiting dilution of different groups of P4 cells (as indicated in table) from Dll1-mCherry reporter mice mammary glands injected into cleared mammary fat pads of recipient mice. For sorting of P4-Dll1hi and P4-Dll1lo, top and bottom 10–12% of the population were chosen from the P4-Dll1+ cell population respectively. In (C) and (D), n = number of mammary fat pad injections as indicated in the table. p value was obtained by Pearson’s Chi-squared test using ELDA software. (E) Representative alum carmine stained mammary outgrowths from transplantation as shown in (C) and (D). (F) GSEA demonstrating enriched MaSC signatures in P4-Dll1hi population compared to P4-Dll1lo populations. In contrast, luminal progenitor cell signatures are enriched in Dll1lo populations. Size bar, 40 μm in (A) and 2 mm in (F) respectively.

