Fig. 3.
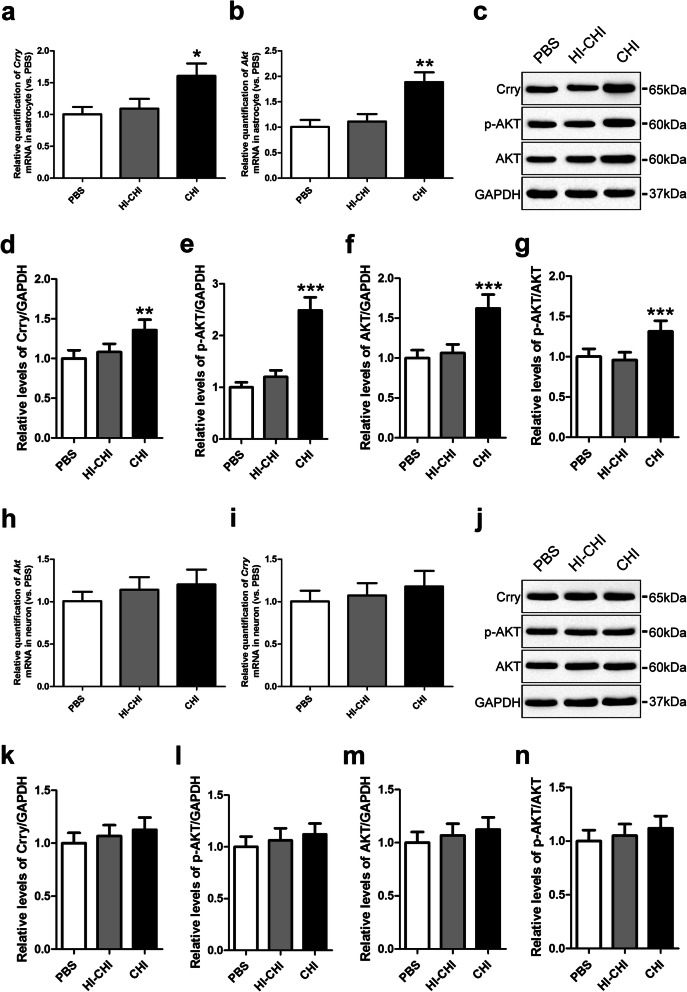
Crry expression and Akt activation in astrocytes and neurons derived from iNSCs receiving CHI mouse serum pre-treatment. a, b RT-QPCR was utilized to determine the expression of the Crry (a) and Akt (b) genes in astrocytes derived from iNSCs among the PBS (iNSCs receiving PBS pre-treatment), HI-CHI (iNSCs receiving HI-CHI mouse serum pre-treatment), and CHI (iNSCs receiving CHI mouse serum pre-treatment) groups following treatment with CHI mouse serum for 45 min (n = 3/group; one-way ANOVA, *P < 0.05, **P < 0.01 versus PBS and HI-CHI groups, respectively). c Representative immunoblots depicting the levels of Crry, p-AKT, and AKT in astrocytes derived from iNSCs among the three groups after CHI mouse serum treatment. d–g Histograms showing the relative levels of Crry (d), p-AKT (e), AKT (f), and p-AKT/AKT (g) in astrocytes derived from iNSCs among the three groups following treatment with CHI mouse serum (n = 6/group; one-way ANOVA, **P < 0.01, ***P < 0.001 versus PBS and HI-CHI groups, respectively). h, i The expression of the Crry (h) and Akt (i) genes in neurons derived from iNSCs among the three groups after CHI mouse serum treatment were determined by RT-QPCR (n = 3/group; one-way ANOVA). j Representative immunoblots depicting the levels of Crry, p-AKT, and AKT in neurons derived from iNSCs among the three groups following treatment with CHI mouse serum. k–n Histograms showing the relative levels of Crry (k), p-AKT (l), AKT (m), and p-AKT/AKT (n) in neurons derived from iNSCs among the three groups after CHI mouse serum treatment (n = 6/group; one-way ANOVA)

