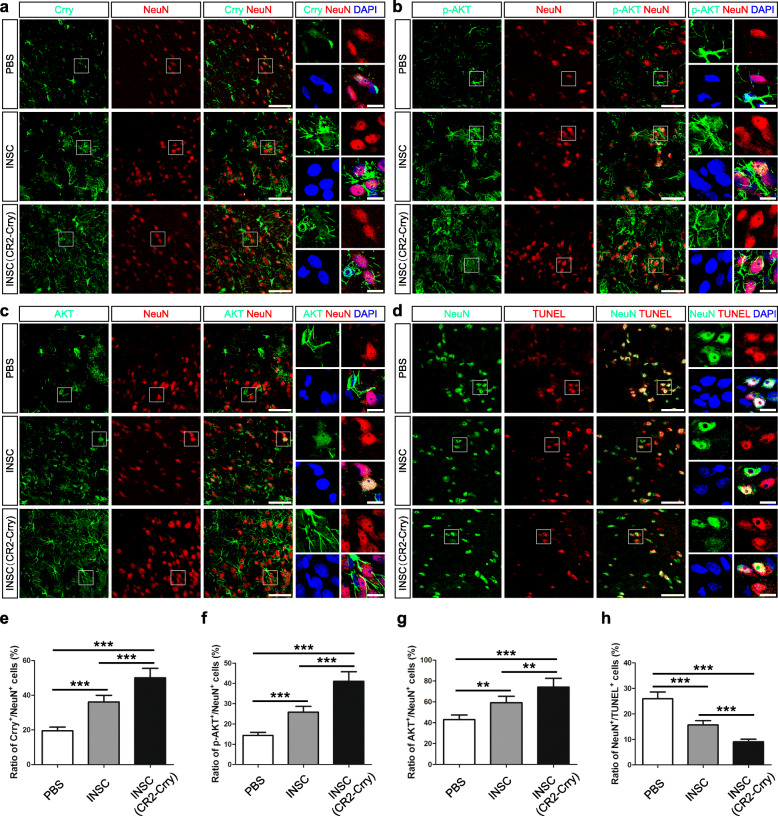
Fig. 7.
Increased levels of Crry expression and Akt activation in neurons in the brains of CHI mice receiving iNSCs pre-treated with CR2-Crry. a–c Representative staining for Crry+ (green, a), p-AKT+ (green, b), AKT+ (green, c), and NeuN+ (red) cells depicting the distribution of Crry+/NeuN+, p-AKT+/NeuN+, and AKT+/NeuN+ neurons in the injured cortex among the PBS (CHI mice receiving PBS), iNSC (CHI mice receiving iNSCs pre-treated with PBS), and iNSC (CR2-Crry) (CHI mice receiving iNSCs pre-treated with CR2-Crry) groups on day 14 post-CHI. Nuclei were counterstained with DAPI (blue). d Representative staining for NeuN+ (green) and TUNEL+ (red) cells depicting the distribution of NeuN+/TUNEL+ neurons in the injured cortex among the three groups at 14 days after CHI. Nuclei were counterstained with DAPI (blue). e–h Histograms indicating the ratio of Crry+/NeuN+ (e, the number of Crry and NeuN double-positive cells/the total number of DAPI-positive cells), p-AKT+/NeuN+ (f, the number of p-AKT and NeuN double-positive cells/the total number of DAPI-positive cells), and AKT+/NeuN+ (g, the number of AKT and NeuN double-positive cells/the total number of DAPI-positive cells), and NeuN+/TUNEL+ (h, the number of NeuN and TUNEL double-positive cells/the total number of DAPI-positive cells) cells in the injured cortex among the three groups on day 14 post-CHI (n = 6/group; one-way ANOVA, **P < 0.01, ***P < 0.001). Scale bar = 50 μm (5 μm)

