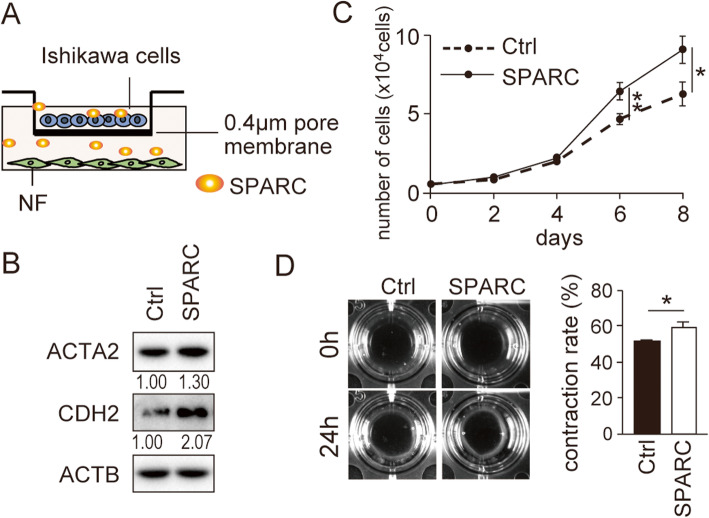
Fig. 4.
Co-culture of SPARC-expressing Ishikawa cells activates normal fibroblasts. (A) Schematic presentation of co-culture experiment of normal fibroblasts (NF) with SPARC-expressing Ishikawa cells. (B) Immunoblotting analysis of ACTA2 and CDH2 in NF co-cultured with SPARC-expressing Ishikawa cells. Intensity of the bands was quantified using Image J. Values of the protein-of-interest were corrected using the intensity of ACTB bands. Full-length blot images are presented in Supplementary Fig. 6. Cell proliferation (C) and in vitro contraction ability (D) of NF were also analyzed. A representative result is shown in the left panels. The right graph shows quantification data of the results. NF, normal fibroblasts; Ctrl, control; *, P < 0.05; **, P < 0.01. The experiments were repeated using fibroblasts from three independent cases and representative data were shown

