Fig. 3.
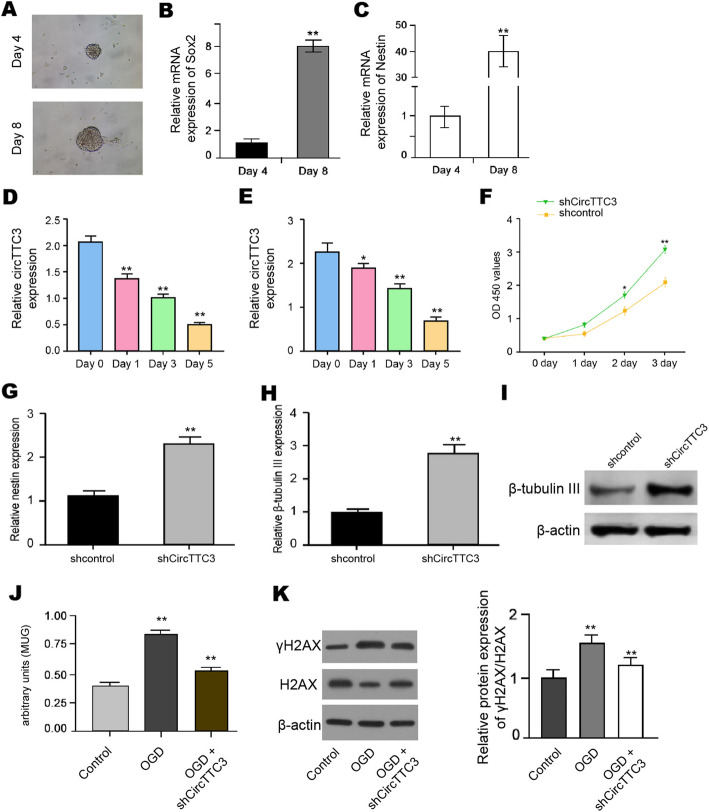
CircTTC3 inhibits proliferation and differentiation of NSCs. a The NSCs were identified by neurosphere formation. b, c The expression of Nestin and Sox2 was measured by qPCR in NSCs. d, e The expression of circTTC3 was measured by qPCR during NSC differentiation into astrocytes and neurons, respectively. f–i The NSCs were treated with control shRNA or circTTC3 shRNA. f The cell viability was measured by MTT assays in the cells. g The expression of nestin was analyzed by qPCR in the cells. h, i The mRNA and protein β-tubulin III expression were tested by qPCR and Western blot analysis, respectively. j Senescence was evaluated by MUG assays. k The protein expression of H2AX, γH2AX, and β-actin was determined by Western blot analysis in the cells. The results of Western blot analysis were quantified by the ImageJ software. Data are presented as mean ± SD. Statistic significant differences were indicated: *P < 0.05, **P < 0.01

