Fig. 5.
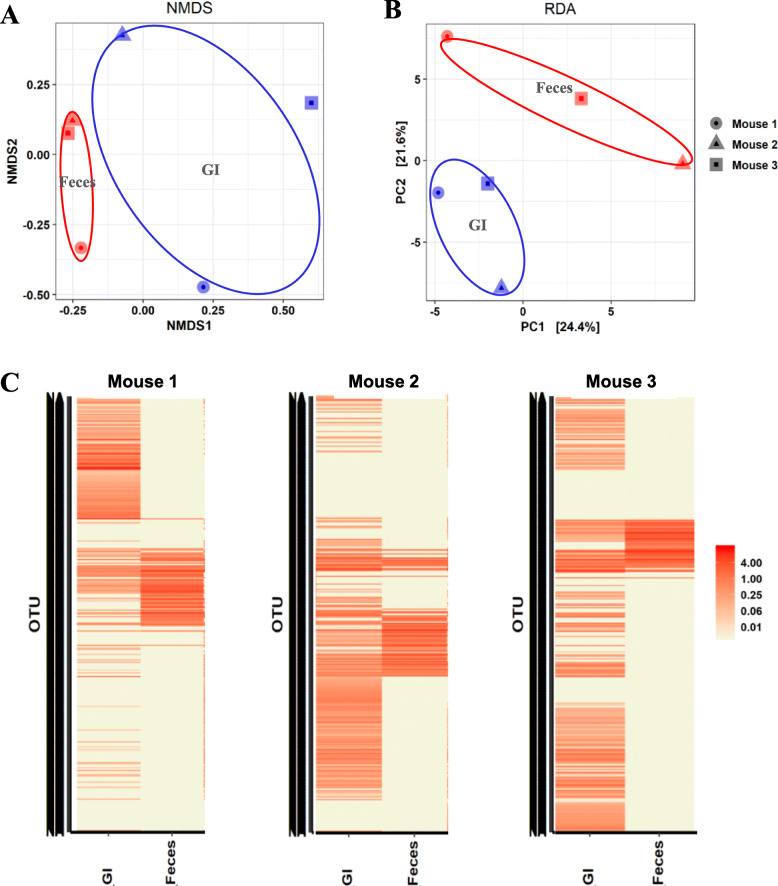
Comparative analysis of microbiome diversity in the GI tract and feces by β-diversity analysis. a. The NMDS plot showing the difference of microbiome between feces and the GI tract at OTU level based on Bray-Curtis distances. The 2D stress was 0.109. b. The RDA plot showing the difference of microbiome between feces and the GI tract at OTU level based on Bray-Curtis distances. c. Heatmap of the microbial composition and relative abundance of all samples based on the Bray–Curtis distance matrix calculated from relative OTU abundances at genus level

