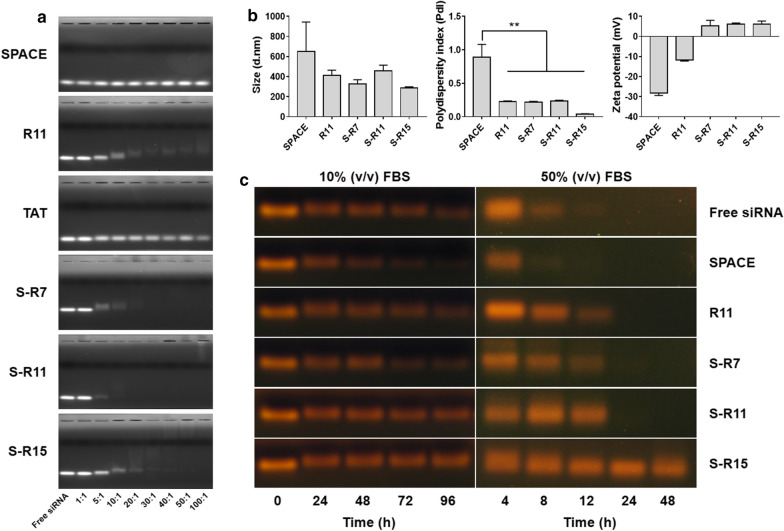
Fig. 2.
Characterization of siRNA/peptide self-assembled nanocomplexes: a Nanocomplex formation was checked using a gel retardation assay. The 21-bp siRNA was mixed with each peptide, i.e., SPACE, R11, TAT, S-R7, S-R11, and S-R15 at N/P ratios of 1:1, 5:1, 10:1, 20:1, 30:1, 40:1, 50:1, and 100:1. After incubation for 30 min, nanocomplexes mixed with a 6× loading dye were loaded into 2% (w/v) agarose gel stained with TopRed. Gel electrophoresis was run in TAE buffer at 100 V for 30 min. The gel was visualized through a ChemiDoc™ XRS + System. The brightness and contrast of each picture were adjusted. b The sizes and zeta potentials of the nanocomplexes were measured using dynamic light scattering. The siRNA of 200 nM final concentration was incubated for 30 min with each peptide: SPACE, R11, S-R7, S-R11, and S-R15. After filtration and vortexing, each nanocomplex was loaded in the cell and analyzed through Nano ZS. Bars represented the average ± standard deviation. The p-value was calculated using a t-test compared to that of SPACE (**p < 0.01, independent n = 3). c siRNA stability was tested in serum. In the left pictures, each siRNA/peptide nanocomplex was incubated in 10% FBS for 24, 48, 72, and 96 h. In the right images, each nanocomplex was incubated in 50% FBS for 4, 8, 12, 24, and 48 h. Then, the samples were mixed with a 6× loading dye and loaded into a 2% (w/v) agarose gel stained with TopRed. Gel electrophoresis was run in the TAE buffer at 100 V for 25–30 min. The gel was visualized through a gel documentation system. The brightness and contrast of each picture were adjusted for the best visualization

