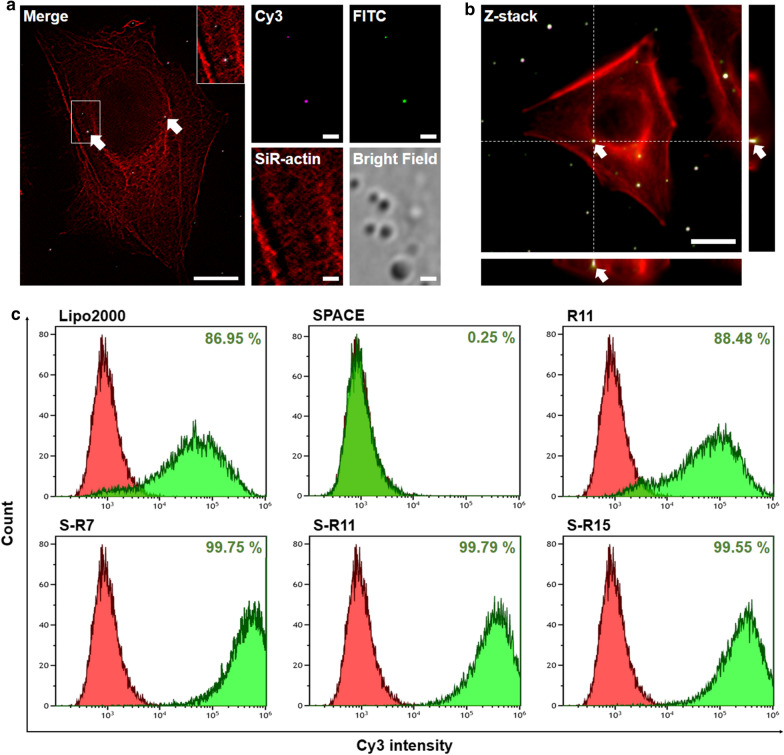
Fig. 4.
Evaluation of the cellular uptake of siRNA/peptide nanocomplexes using fluorescence analysis: a Single-molecule images of the siRNA/S-R15 nanocomplex were acquired using a super-resolution radial fluctuation. 2.0 × 10⁴ HeLa cells were incubated in a 35-mm confocal dish. The nanocomplex with the final 50 nM of siRNA and S-R15 (20:1 N/P ratio) was applied to the cells for 4 h. Cy3-labeled siRNA and FITC-labeled S-R15 peptide were observed in magenta and green, respectively, at 900× magnification (scale bar = 1 µm). Actin filaments were labeled using a SiR-actin kit (red). Fluorescence images of Cy3, FITC, and SiR-actin were merged using ImageJ software. Co-localization of the nanocomplex was visualized with arrowed white spot-like areas in a merged image (scale bar = 10 µm). b Cellular internalization of the siRNA/S-R15 nanocomplex was confirmed using a Z-stack image. Actin filaments were labeled using a SiR-actin kit (red). The arrowed white spot-like areas demonstrated co-localization of siRNA and peptide in the cytoplasm at 900× magnification (scale bar = 5 µm). The right and bottom images showed a cross-sectional z-axis image of the arrowed white spot. c Cellular uptake of the Cy3-labeled siRNA/peptide nanocomplexes was evaluated using flow cytometry. 200 nM siRNAs were delivered into 3.0 × 10⁵ HDFn cells via PC: Lipofectamine™ 2000, SPACE, R11, S-R7, S-R11, and S-R15 (20:1 N/P ratio) for 4 h. Fluorescence cells of free siRNA and each condition were exhibited in red and green populations, respectively. The population of fluorescence-positive cells was expressed as a percentage.

