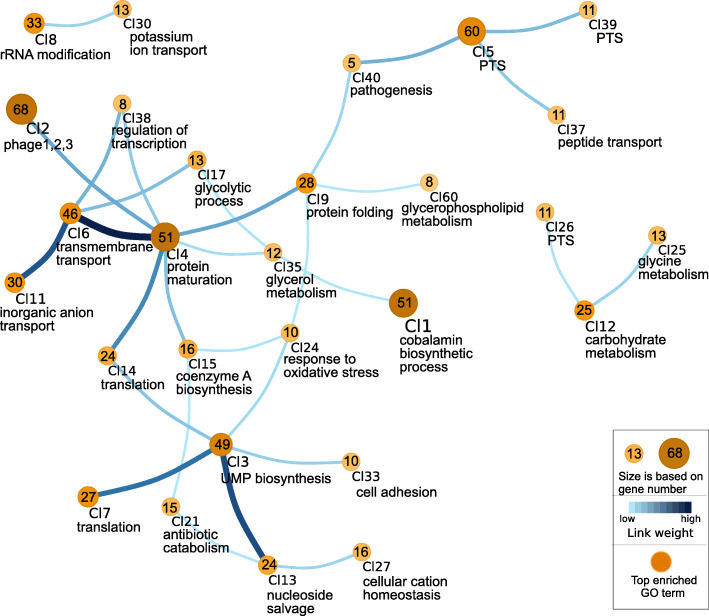
Fig. 6.
Visualization of clustered genes based on gene network inference in L. monocytogenes ScottA. Each node represents a cluster and edges represent predicted links between clusters. Number of genes within the clusters is shown in the center of the node. Below the cluster, top-scored enriched GO term is given. The used scales are described in the box. For simplification, the figure shows only the top 30 links with the highest weight, and their connected clusters. Genes within the clusters, and all links between clusters are listed in the Table S12

