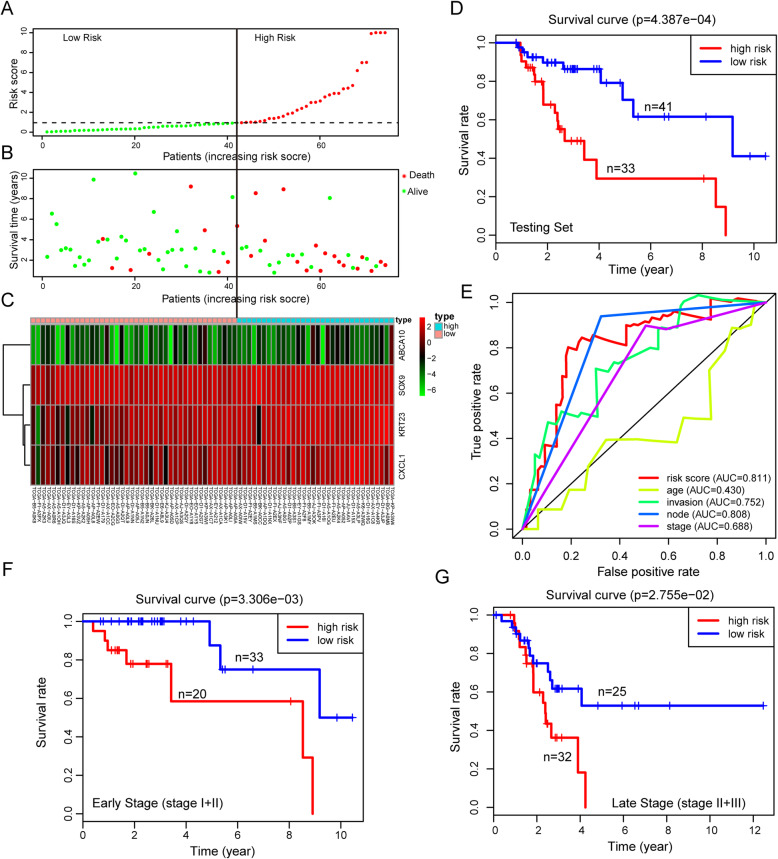
Fig. 3.
Validation of the 4-gene signature in predicting OS in the testing set and different stage patients. a-c The distribution of risk score, OS, and survival status and the 4 genes expression patterns for the 74 patients in the training set. d Kaplan–Meier analysis compares OS between patients in the high- and low-risk group in the testing set. g ROC analysis of the 4-gene signature and other clinicopathological parameters (age, invasion, node metastasis and stage) for prediction OS in the testing set. f Kaplan-Meier analysis compares OS between patients in the high- and low-risk group in early stage (I + II) patients. g Kaplan-Meier analysis compares OS between patients in the high- and low-risk group in late stage (III + IV) patients

