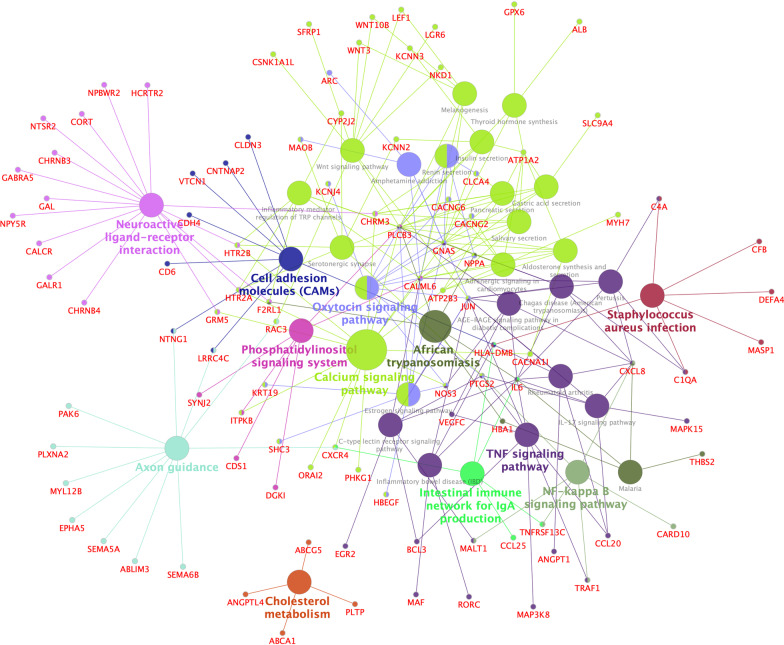
Fig. 4.
KEGG Pathway Enrichment Analysis of DE mRNAs. The results of Kyoto Encyclopedia of Genes and Genomes (KEGG) analysis acquired by ClueGO/CluePedia software were visualized by a Cytoscape platform, with p < 0.05 as the cutoff value. Terms grouped with a kappa score level (≥ 0.4) are shown as nodes of different colors. The size of each node represents significances whereas only the labels of the most critical terms per group are shown in colors. Edges link small nodes representing genes that are related to the corresponding terms. DE, differentially expressed

