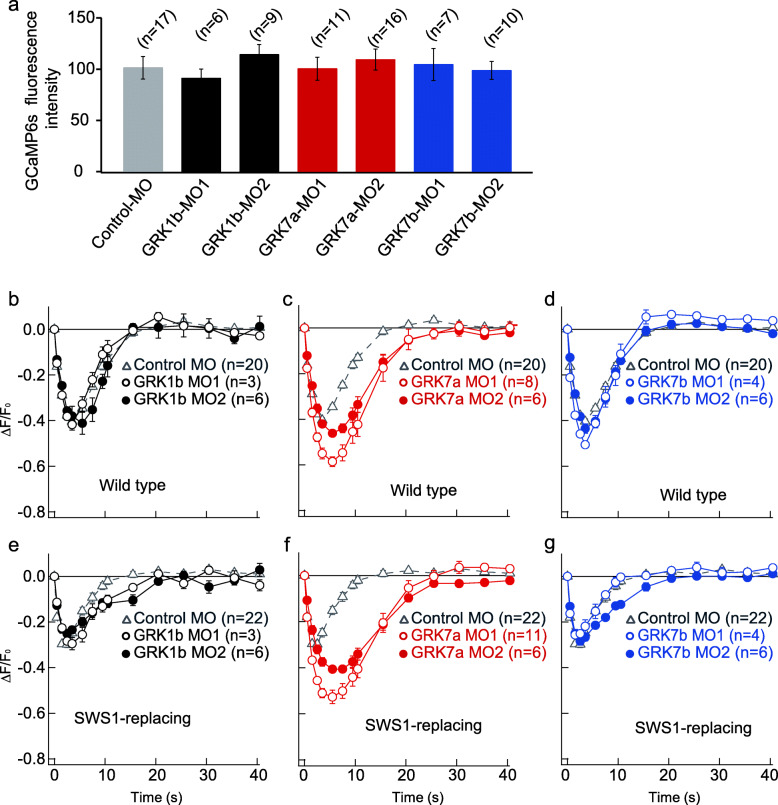
Fig. 2.
The light responses of PP1 cells in zebrafish larvae were affected by GRK knockdown. a Quantification of GCaMP6s fluorescence intensity in larvae injected with control MO or one of the GRK MOs. The error bars indicate the standard error. b-g Calcium changes upon 405 nm laser flashes showing the effects of GRK knockdown on light responses in the PP1 cells of wild-type larvae (b-d) and SWS1-replacing larvae (e-g). b and e GRK1b MO-knockdown larvae. GRK1b-MO1, black open circle; GRK1b-MO2, black closed circle. c and f GRK7a MO-knockdown larvae. GRK7a-MO1, red open circle; GRK7a MO2-knockdown larvae, red closed circle. d and g GRK7b MO-knockdown larvae. GRK7b-MO1, blue open circle; GRK7b-MO2, blue closed circle. Gray open triangles in b-g indicate control MO-injected larvae. The number of animals tested (n) is indicated in parentheses after the MO names in each panel. The error bars indicate the standard error. The duration of each stimulus was ~ 450 ms

