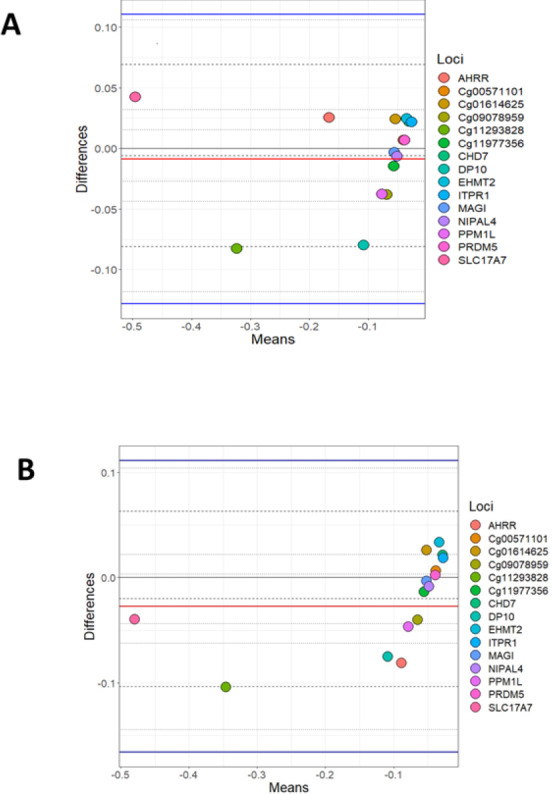
Figure 1. Bland Altman of BSAS vs EPIC for cases and controls.

Bland Altman plots showing the log mean differences between DNA methylation as measured by EPIC array vs. the same CpG sites measured using BSAS. (A) Data from cannabis users, gathered using BSAS and the EPIC array (Cases); (B) the control subjects used in BSAS and the EPIC array. Each of the 15 points represents the CpG sites investigated. Dotted lines represent the limits of agreement, red the mean, blue in the 95% confidence intervals.
