FIGURE 3.

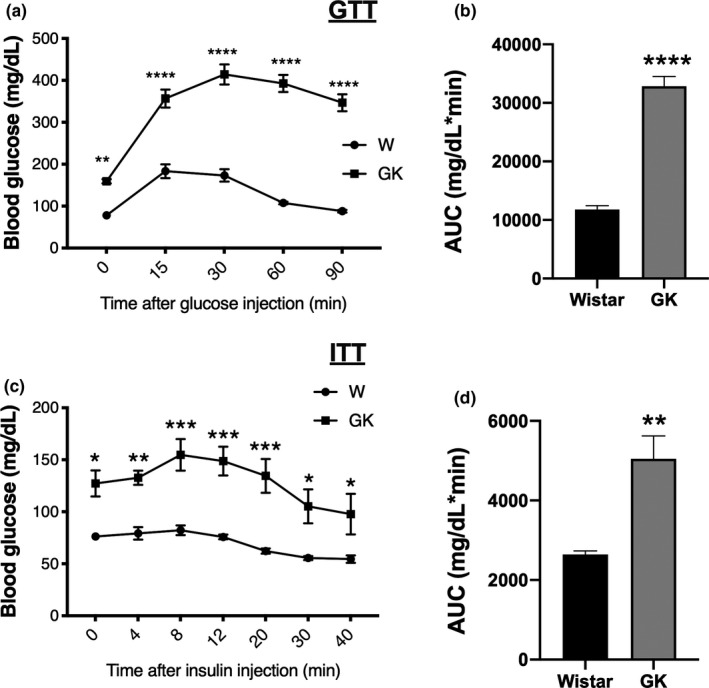
(a) Blood glucose concentrations measured before (time 0) and during the glucose tolerance test—GTT. (b) GTT area under the blood glucose concentration curve (Wistar 11,783 ± 666 vs GK 32850 ± 1651). (c) Blood glucose concentrations measured before (time 0) and during the insulin tolerance test—ITT. (d) ITT area under the blood glucose concentrations curve (Wistar 2641 ± 90.7 vs GK 5049 ± 576.1). *p < 0.05; **p < 0.01; ***p < 0.001; ****p < 0.0001
