
Fig. 1.
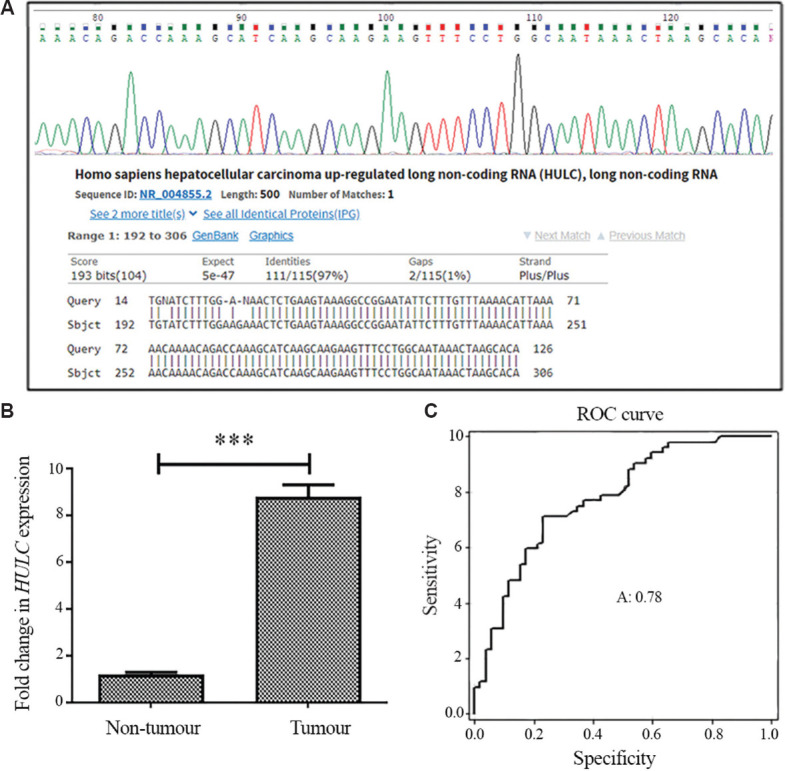
Expression of HULC in breast cancer and receive operating characteristic (ROC) curve analysis for predicting breast cancer prognosis. (A) Confirmation of HULC expression by Sanger sequencing. (B) Real-time qRT-PCR analysis of HULC expression level in cancerous and adjacent non-tumour breast tissues. Values are mean±SEM (n=3). (C) ROC curve for HULC to discriminate between tumour and non-tumour tissues. The area under the ROC (AUC) is 0.78 (P<0.001). The sensitivity and specificity were 0.71 and 0.77, respectively and cut-off value was 17.1. Real-time qRT-PCR, real-time quantitative reverse transcription polymerase chain reaction.