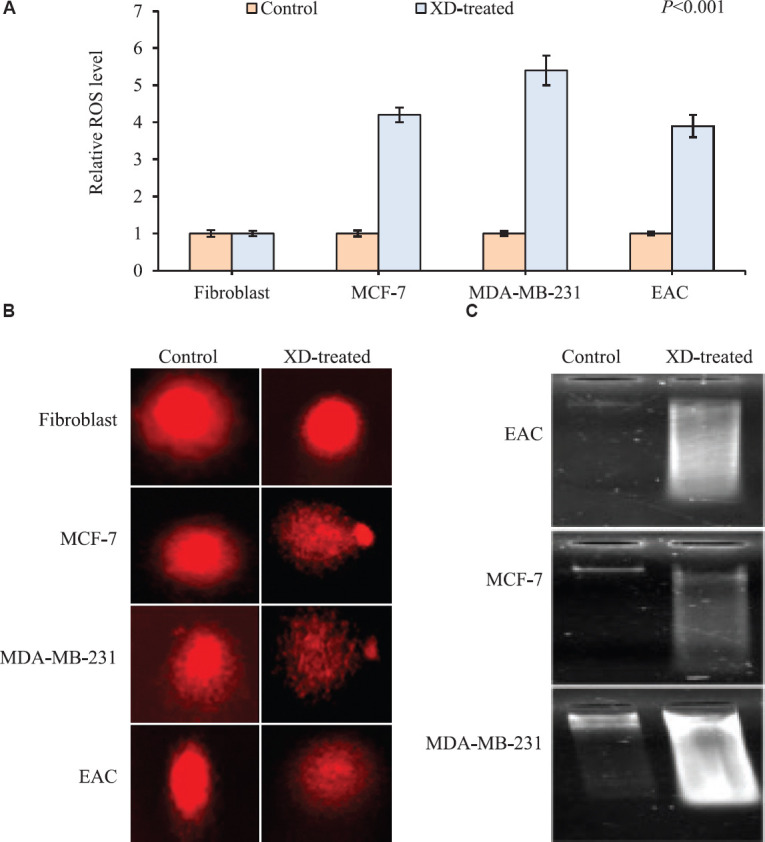
Fig. 2.

(A) Graphical representation of intracellular ROS generation upon XD treatment in cancer cells (EAC, MCF-7 and MDA-MB-231) at their respective IC50 dosage (8.1, 1 and 5 μM) and in normal cells (fibroblast) at highest dose of 40 μM by DCFH-DA assay. XD treatment caused a significant increase in intracellular ROS of cancer cells, whereas no induction in ROS was seen in normal cells. Data represented as mean±SD with significance P<0.001. (B) Representation of DNA damage upon XD treatment in cancer cells (EAC, MCF-7 and MDA-MB-231) at their respective IC50 dosage (8.1, 1 and 5 μM) and in normal cells (fibroblast) at the highest dose of 40 μM by comet assay. XD treatment caused significant DNA damage in cancer cells, as evidenced by growing tail length, whereas no DNA damage was seen in normal cells. (C) Representation of DNA damage upon XD treatment in cancer cells (EAC, MCF-7 and MDA-MB-231) at their respective IC50 dosage (8.1, 1 and 5 μM) and in normal cells (fibroblast) at the highest dose of 40 μM by agarose gel electrophoresis assay XD treatment caused significant DNA damage in cancer cells as evidenced by smearing pattern in all the three cancer cells.
