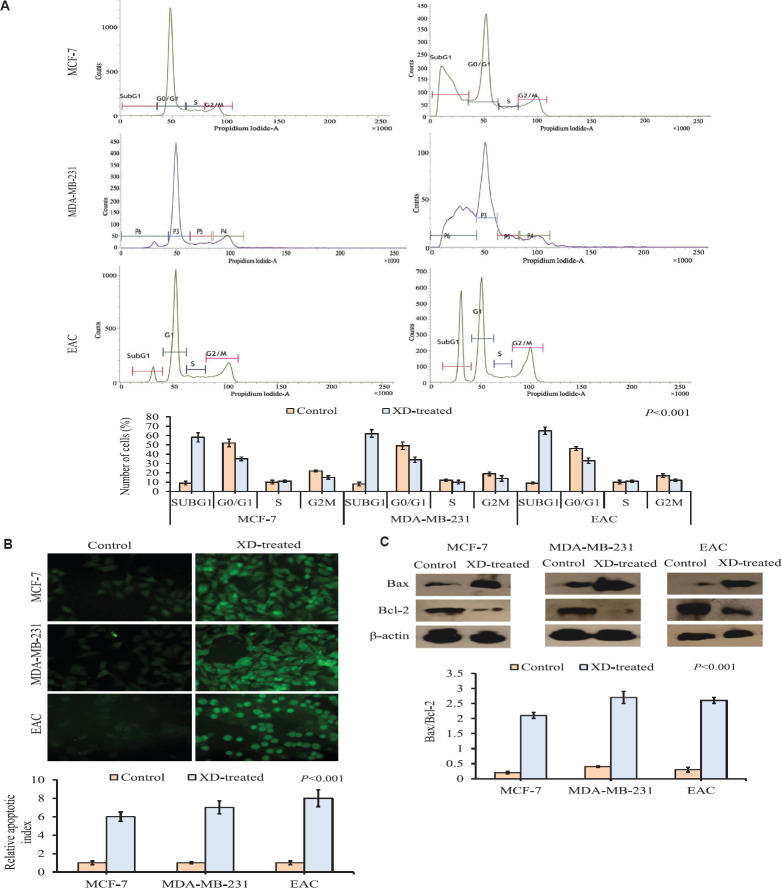
Fig. 3.
(A) Cell cycle phase distribution analysis in experimental groups received XD treatment compared to control in EAC, MCF-7 and MDA-MB-231 cells. Graphical representation of cell cycle phase distribution showing the per cent of cells in each phase of the cell cycle. A significant (P<0.001) increase in SubG0 population in XD-treated group was observed compared to control group in all the three cancer cells. (B) Representation of in situ TUNEL assay (apoptotic population) in EAC, MCF-7 and MDA-MB-231 cells samples of the experimental groups, control and XD-treated. A significant upregulation in number of apoptotic cells of XD-treated group compared to the control group was observed in all the three cells. Representative microscopic photographs of TUNEL positive cells were brightly fluorescent. Photographs were taken under ×20 magnification of the fluorescent microscope. Scale bar 50 μM. (C) Expression of Bax and Bcl-2 by Western blot of control and XD-treated experimental groups of EAC, MCF-7 and MDA-MB-231 cells. Representative blots showed reduced Bcl-2 expression and increased Bax expression in the treated group compared with control in all the three cells. Densitometric analysis through graphical representation showed the relative expression of individual markers. The loading control β-actin normalized peak density. Data represented as mean±SD with significance P<0.001.

