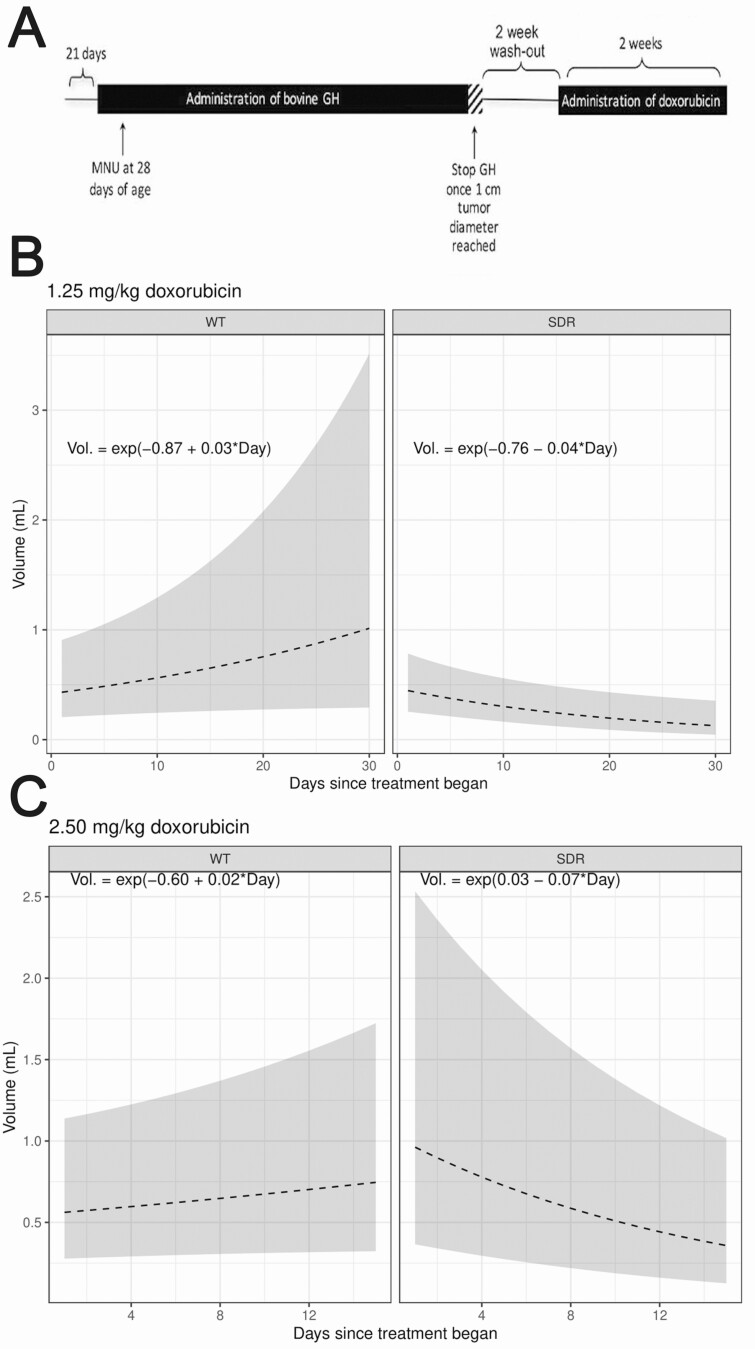
Figure 3.
Tumor volumes in experimental rats were modeled based on observable tumor volumes. (A) An outline of the experimental design used for this study. (B) Model-estimated tumor growth curves, along with approximate 95% CIs, are shown for both WT (n = 7 tumors) and SDR (n = 11 tumors) type rats treated with 1.25 mg/kg doxorubicin. (C) Model-estimated tumor growth curves, along with approximate 95% CIs, are shown for both WT (n = 6 tumors) and SDR (n = 4 tumors) type rats treated with 2.5 mg/kg doxorubicin. At both doses, SDR tumors had an overall decreasing tumor trajectory while the WT tumors grew over the observed time period, this difference in slopes was found to be statistically significant (P < 0.0001).

