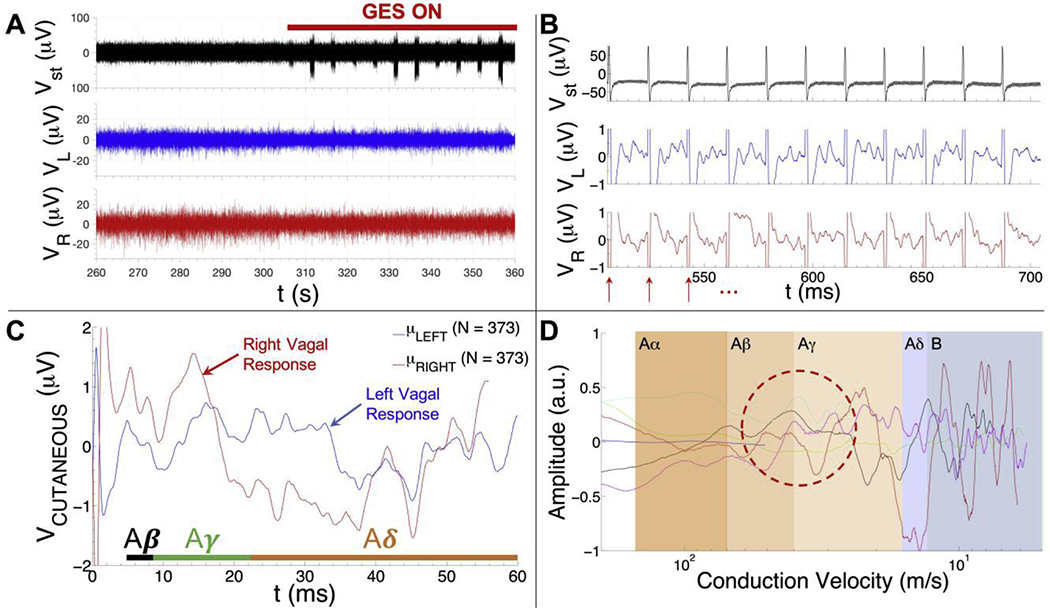
Fig 2.

Summary of GES-associated signal processing pipeline. A) Cutaneous recordings were collected with an 8-channel PowerLab system (AD Instruments) using the cutaneous recording electrode placements from Fig. 1. A 100 s long segment of a high pass-filtered EKG (top trace), left vagal (middle trace) and right vagal (bottom trace) recording is shown from one subject (v003). The GES device is turned on at ~306 s in the recording (red bar). B) Representative data collected from one subject (subject v003) whose GES device was on and tuned to a pulse repetition frequency of 55 Hz (top: stimulus artefacts detected from the high pass-filtered EKG trace; middle: cutaneous recording over the left vagus nerve; bottom: cutaneous recording over the right vagus nerve). Red arrows show the stimulus artefact locations. Raw response data associated with GES is visible in the left vagal (middle row) and right vagal (bottom row) channels during the 18 ms intervals between stimulus artefacts. C) Mean cutaneous response recorded over the left (blue trace) and right vagus (red trace) nerve of another subject (subject v011) whose GES device was on and tuned to a pulse repetition frequency of 14 Hz (mean of N = 373 responses). The time intervals where one would expect to find Aβ, Aγ and Aδ fiber responses are shown in the plot (time intervals were computed using the 33 cm conduction distance for subject v011). D) Mean left vagal cutaneous response to gastric electrical stimulation as a function of conduction velocity (i.e., speed) for six human subjects (normalized to the maximum response voltage detected among all six traces to aid visual comparison). Note that the blue trace only extends into the Aβ range and the light blue/cyan trace only extends into the Aγ range. These traces are from subjects whose prescribed stimulus pulse repetition frequency was tuned to 55 Hz (blue) and 28 Hz (light blue/cyan), respectively, as opposed to the typical value of 14 Hz. The red dashed oval is intended to highlight the relative consistency of the left vagal Aγ volley observed in different subjects.
