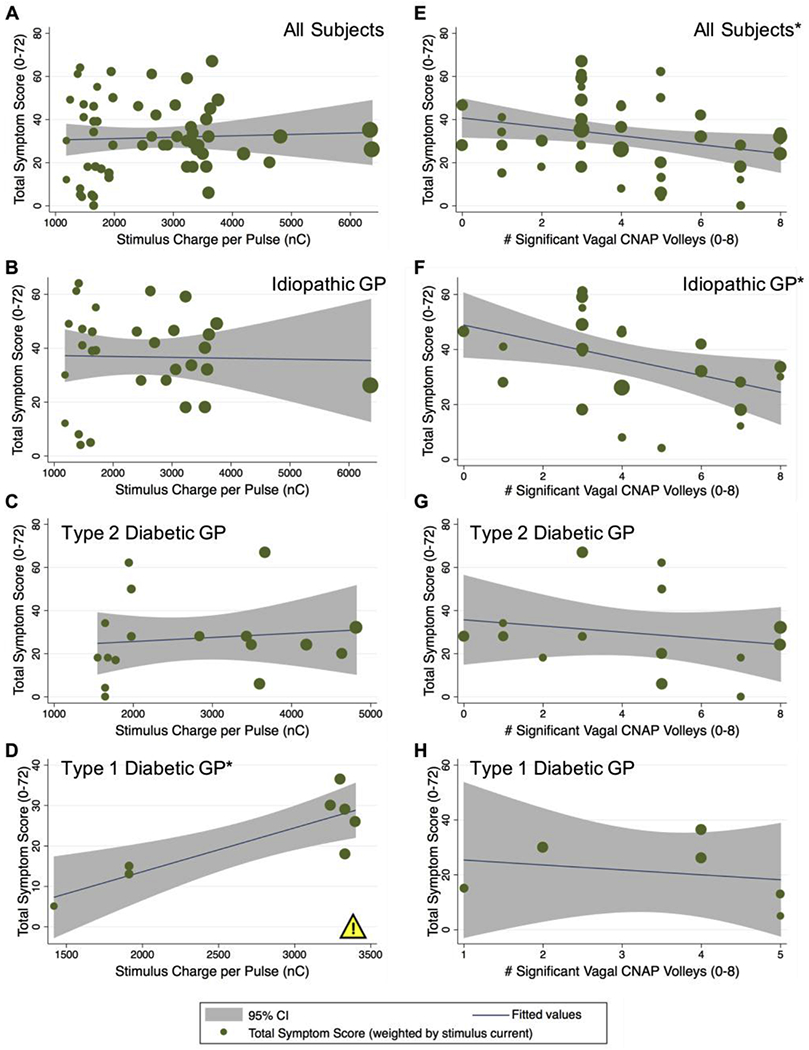
Fig. 4.

Effect of stimulus strength and fiber recruitment on total GCSI symptom score. Regression analysis to determine if stimulus charge per pulse and/or fiber recruitment number predict improvements in total GCSI symptom scores. A-D: Total symptom score versus stimulus charge per pulse (in nC) for all (N = 66) subjects (A), the n = 35 subjects with idiopathic gastroparesis (B), the n = 19 subjects with type 2 diabetic gastroparesis (C), or the n = 9 subjects with type 1 diabetic gastroparesis (D). Increasing stimulus charge per pulse predicted a higher total symptom score in type 1 diabetics (p < 0.01), suggesting a worsening of their condition rather than an improvement as more energy is delivered. E-H: Total symptom score versus the total number of significant CNAP volleys from the left and right vagal recordings (0-8) for all N = 66 subjects (E), for n = 35 subjects with idiopathic gastroparesis (F), for n = 19 subjects with type 2 diabetic gastroparesis (G), or for n = 9 subjects with type 1 diabetic gastroparesis (H). Increasing the number of significant CNAP volleys predicted a significant decrease in total symptom score for all subjects (E) (*p < 0.05) and for subjects with idiopathic gastroparesis (F) (*p < 0.05), suggesting an improvement in their condition with greater recruitment of the vagus. The yellow warning/caution icon highlights a potential side effect of stimulation observed among type 1 diabetic subjects, inferred from a statistically significant increase in symptom score with increasing stimulus intensity.
