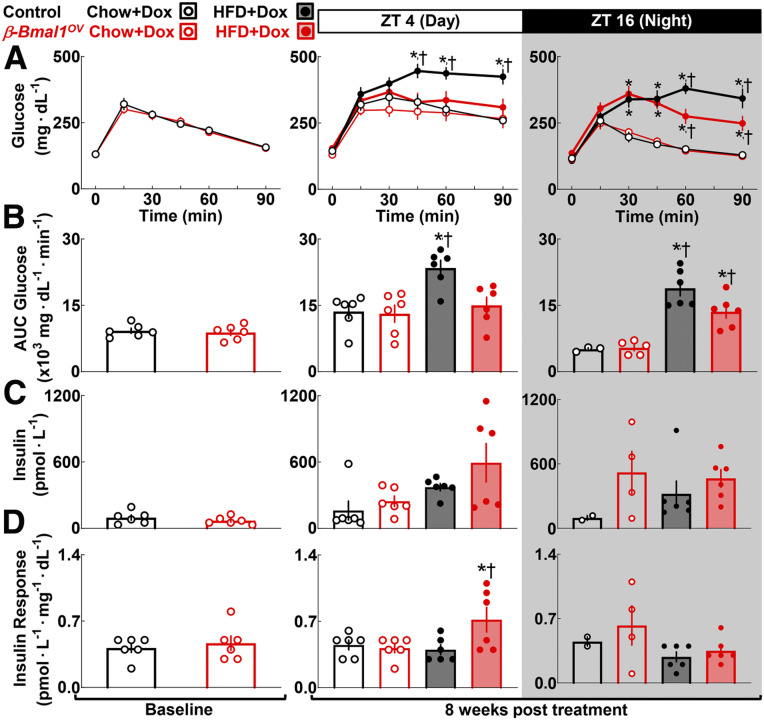
Figure 4.
β-Cell Bmal1 overexpression enhances in vivo glucose tolerance in response to diet-induced obesity in male mice. Graphs depict sampled blood glucose during i.p. GTT (A), corresponding glucose AUC during GTT (B), plasma insulin collected at 15 min post-glucose administration during GTT (C), and corresponding insulin response expressed as insulin/glucose at 15 min post-glucose administration during GTT performed at the ZT 4 and ZT 16 time points in control (+/+Ins2rtTA/+) and β-Bmal1OV (Bmal1-HAtetO/+Ins2rtTA/+) male mice at baseline (2 months of age) and after 8-week exposure to 60% HFD + DOX vs. chow + DOX (D). Data are mean ± SEM (n = 6 mice per genotype/diet except as a result of sampling difficulties for insulin/insulin response at ZT 16 for β-Bmal1OV-chow and control-chow). *P < 0.05 for diet; †P < 0.05 for genotype.

