Figure 2.

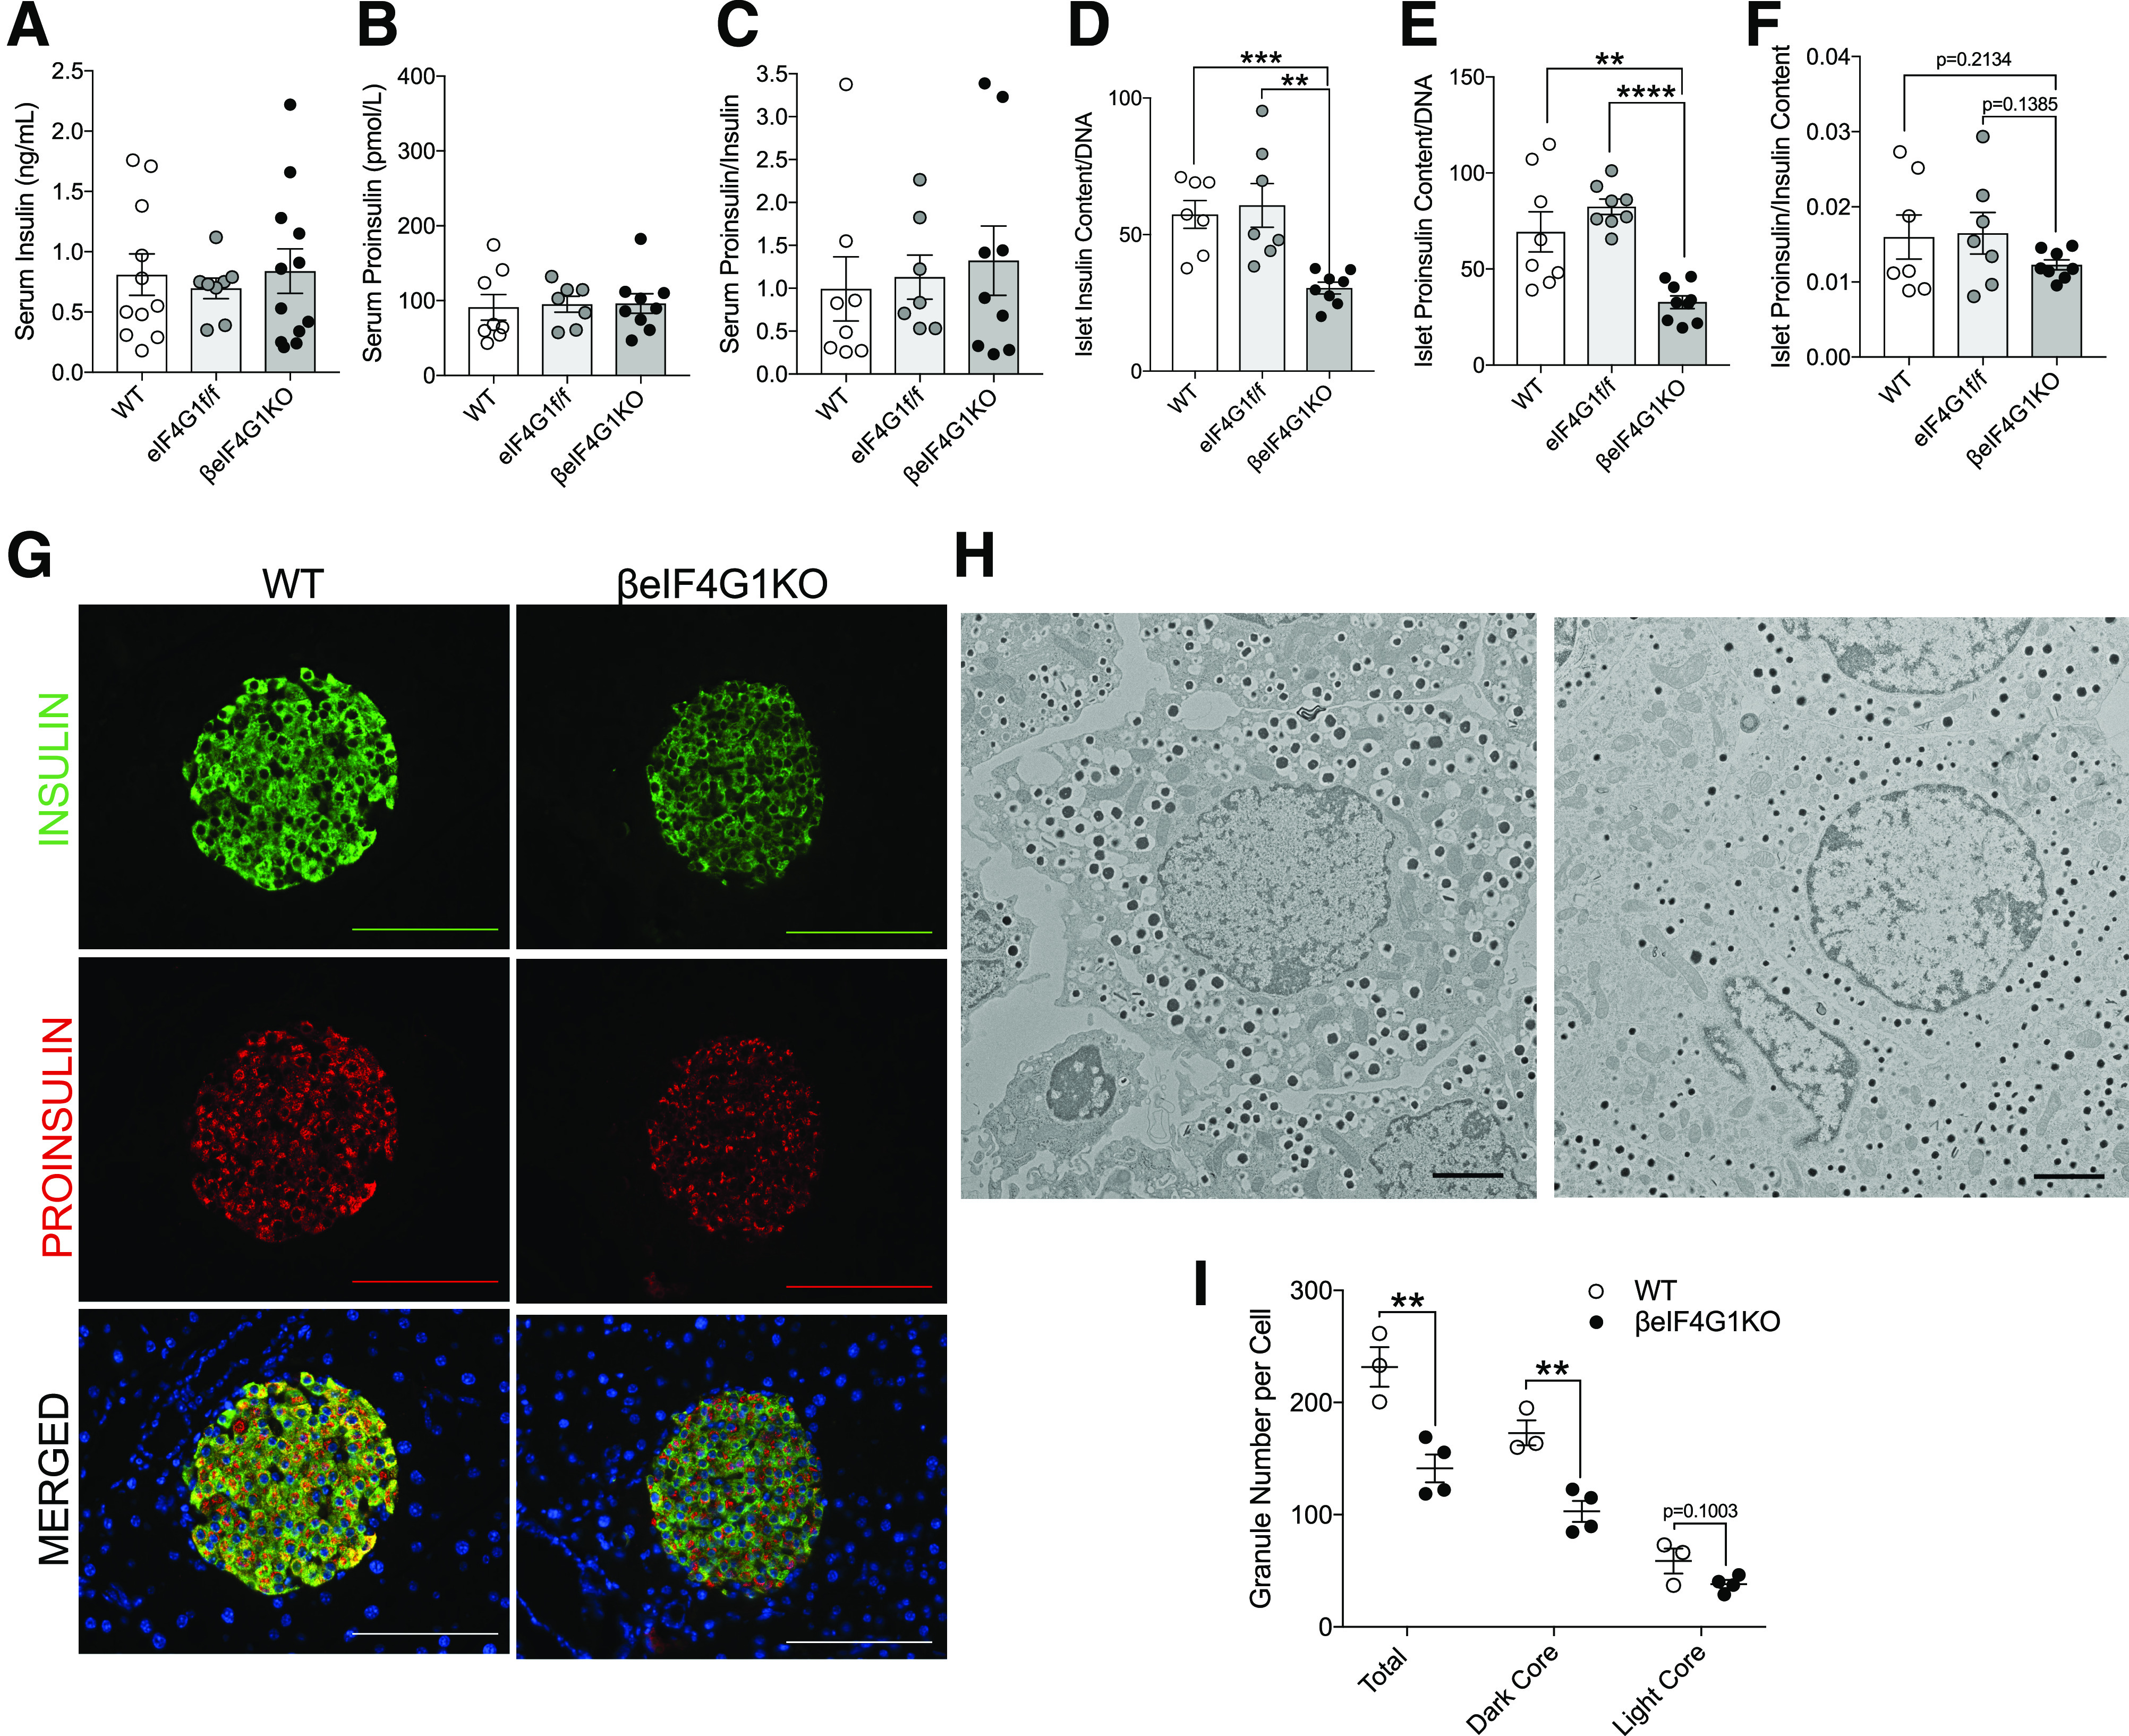
Normal insulin processing persists in β-cell–specific eIF4G1KO mice. Phenotype of 15-week-old WT, eIF4G1f/f, and βeIF4G1KO mice showing insulin, proinsulin, and proinsulin-to-insulin ratio values from in vivo random-fed serum (n = 8, 7, 9, respectively) (A–C), and isolated islets (n = 7, 7, 8, respectively) (D–F). G: Immunofluorescent images of pancreatic sectioned islets from 20-week-old animals showing insulin (green), proinsulin (red), and DAPI (blue). Immunofluorescent image scale bars, 100 μm. EM image of β-cells between WT and βeIF4G1KO islets (H), with quantification of insulin granules: total number, dark core, and light core (I) (n = 3 to 4 animals; 5–15 β-cells counted per animal). EM images scale bars, 2 μm. Representative of three to four animals per group for imaging data. WT are mix of Rip-Cre(+) and Rip-Cre(−) mice with no floxed genes. Statistical analyses were conducted using unpaired, two-way Student t test with significance: **P < 0.01, ***P < 0.001, ****P < 0.0001.
