
Figure 8.
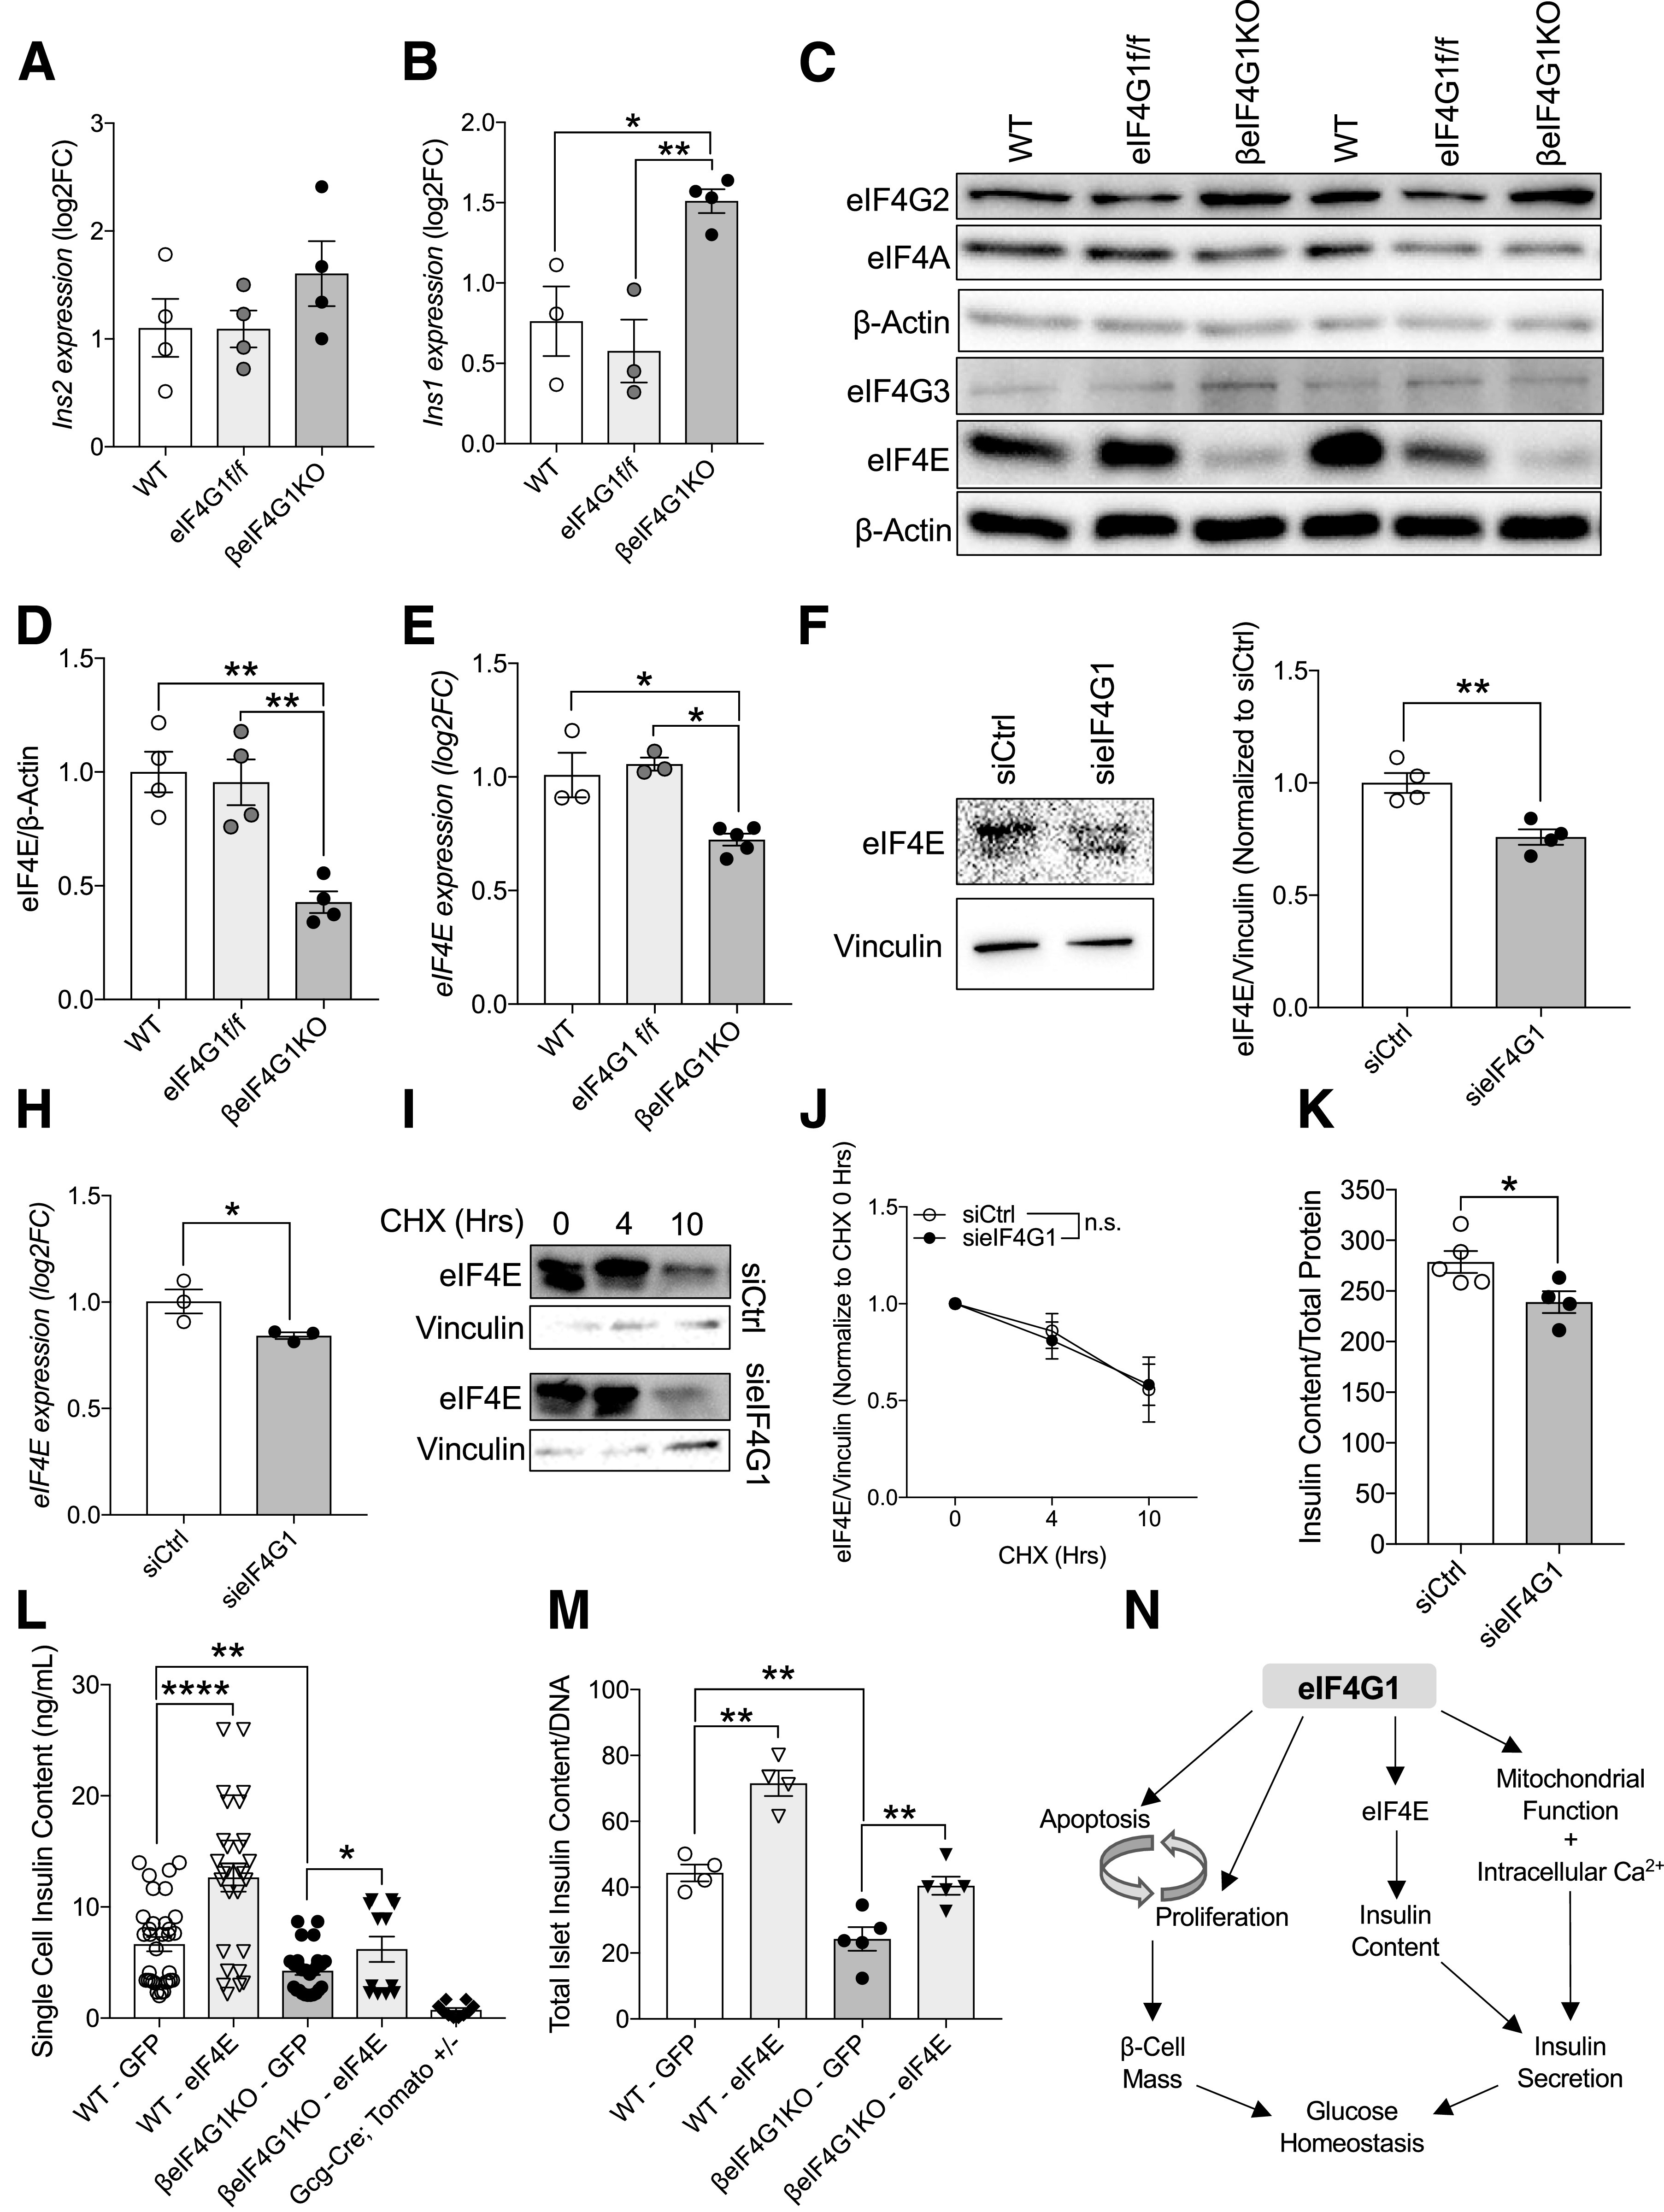
eIF4E-eIF4G1 interaction is important in regulating insulin content in β-cells. qPCR measuring Ins2 (A) and Ins1 (B) transcripts from isolated islets (relative to β-Actin, log2 fold-change [FC] to WT). Representative immunoblot (C) and quantitation of protein levels in WT, eIF4G1f/f, and βeIF4G1KO islets (relative to β-actin, normalized to WT) (n = 4) for eIF4E (D) (n = 4). E: mRNA level of eIF4E (relative to β-Actin, log2FC to WT) from isolated islets (n = 3–5). eIF4E protein (F and G), mRNA (H), and stability (I and J) from sieIF4G1 knockdown INS-1 cells (n = 3). K: INS-1 cell insulin content from siCtrl and sieIF4G1 knockdown (n = 4–5). L: Insulin content from handpicked GFP plus dispersed individual islet cells from WT and βeIF4G1KO (n = 3 experiments per panel) using a microscope with magnification ×60. Td-Tomato plus cells from Gcg-cre;Tomato+/− islets were included in (L) as an insulin-negative control threshold. M: Insulin content from ∼10 to 25 whole dispersed islets infected with adenoviral GFP or eIF4E (n = 4–5). WT are a mix of Rip-Cre (+) and Rip-Cre (−) mice with no floxed genes. Statistical analyses were conducted using the unpaired, two-way Student t test with significance at P < 0.05. N: Schematic diagram depicts the role of eIF4G1 expression regulating 1) β-cell turnover in modulation of both proliferative and apoptotic signals, 2) insulin content through its regulation of 5′ cap-binding protein, eIF4E, and 3) insulin secretory capacity contributed by mitochondrial/intracellular Ca2+ signals. *P < 0.05; **P < 0.01, ****P < 0.001.