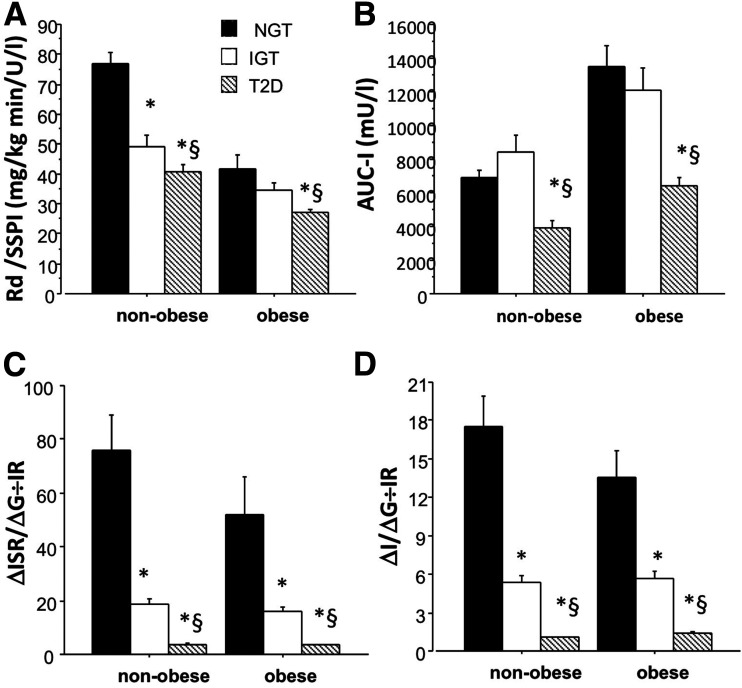
Figure 1.
A: Rd factored by insulin at the end of the clamp. B: AUC of insulin during the OGTT. C: Changes in incremental insulin secretion divided by incremental glucose concentrations during OGTT factored by IR. D: Changes in incremental insulin concentrations divided by incremental glucose concentrations during OGTT factored by IR in individuals with NGT, IGT, and T2DM based on BMI (i.e., nonobese if BMI <30 kg/m2 or obese if BMI ≥30 kg/m2). *P < 0.05 T2DM vs. NGT; §P < 0.05 T2DM vs. IGT.

