
Figure 6.
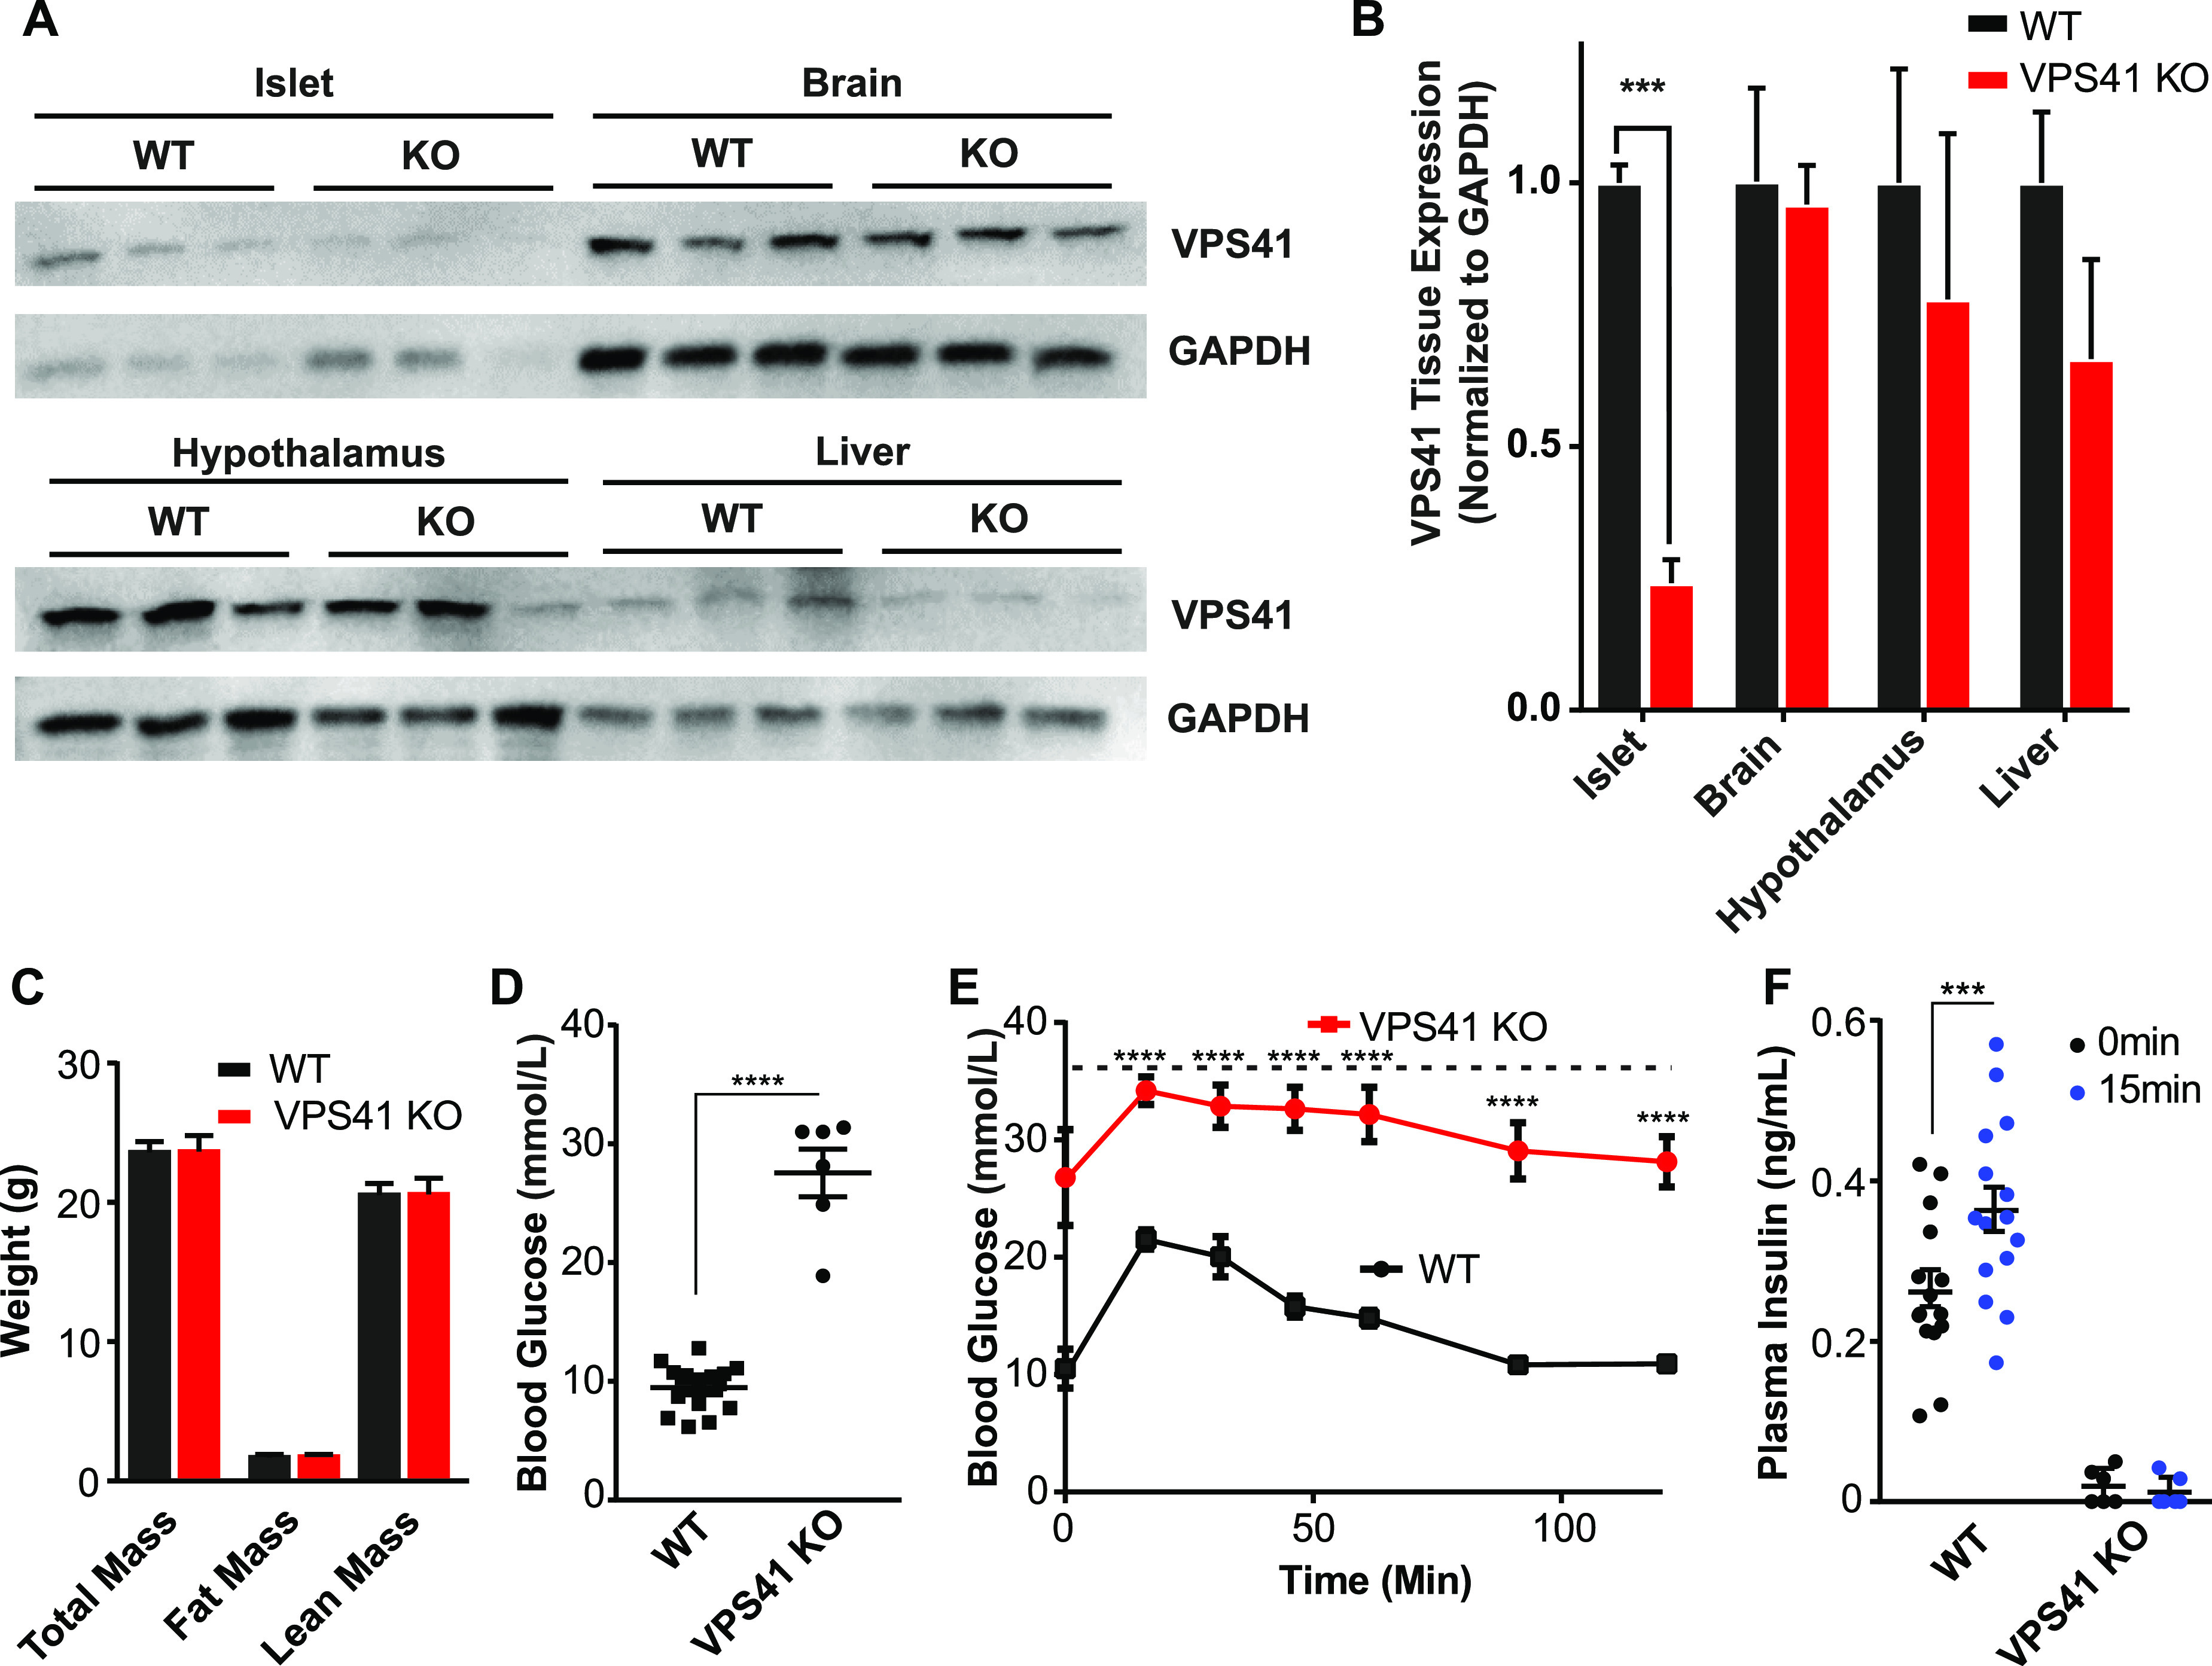
A: Representative Western blots of VPS41 protein levels in various tissues from 15-week-old age-matched WT or VPS41 KO mice. B: Quantification of VPS41 protein expression levels normalized to GAPDH. Data indicate mean ± SEM; n = 3. ***P < 0.001. C: Fat and lean mass measurements of age-matched 8-week-old WT and VPS41 KO mice. D: Blood glucose measurement of mice fasted for 8 h. E: Blood glucose measurements during glucose tolerance test. The dashed lines indicate the maximum value of the glucometer. F: Circulating blood insulin levels before and 15 min after glucose injection. Data indicate mean ± SEM; KO, n = 6; and WT, n = 15. ***P < 0.001, ****P < 0.0001, secretion data analyzed by one-way ANOVA.