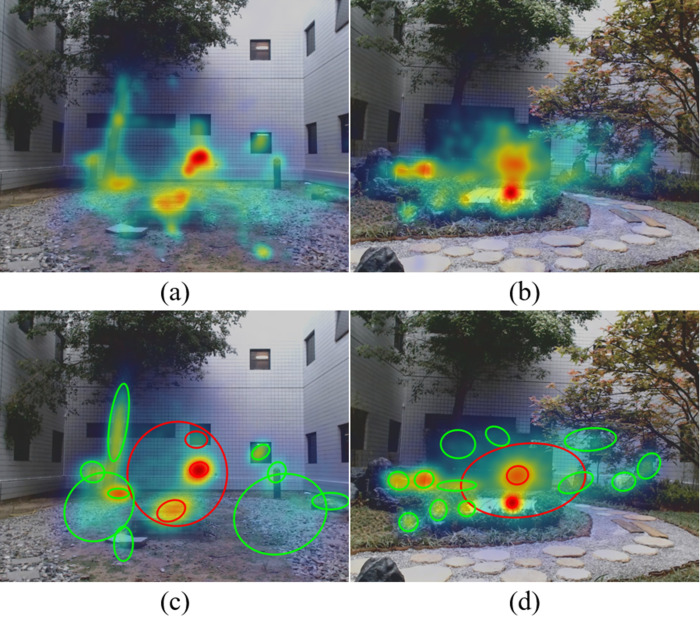
Figure 3.
The first row shows measured gaze heat maps in the (a) simple courtyard and (b) Japanese garden. Red/blue indicates more/less eye gaze. The second row shows the heat maps generated by the HMMs for the (c) simple courtyard and (d) Japanese garden, and the covariance ellipses of the GMM states. Red/green ellipses correspond to the central/peripheral states.

