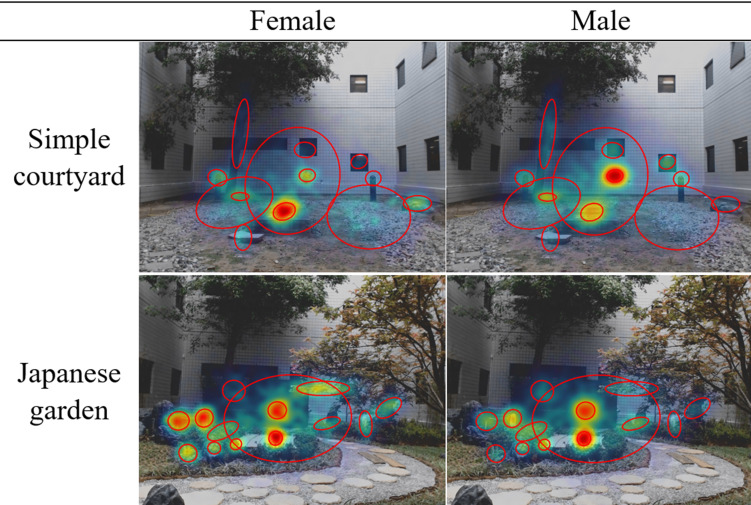
Figure 5.
The plots show the heat maps of the gaze trajectories generated by Gaussian mixture models with the same mixture means and covariances, but different mixture weights. Red indicatesmore frequently fixated areas. Blue indicates less frequently fixated areas. The ellipses are the covariance ellipses of the Gaussian clusters.

