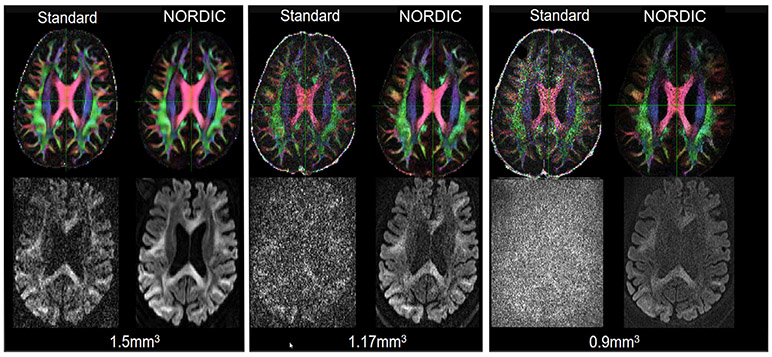
Fig. 5.
Top row shows the effect of NORDIC across different resolutions on FA maps for a single slice. Bottom row presents corresponding diffusion weighted image (b = 3000 s/mm2) for the same slice. The FA maps are obtained after EDDY processing, and the images in the bottom row are before EDDY processing. From left to right, in groupings of 4, the three resolutions of 1.5 mm, 1.17 mm and 0.9 mm are shown. For each grouping, the images with the standard processing are shown adjacent to the images with the NORDIC processing. Supplemental Fig. S3, illustrates the same slices and also includes reconstruction by MPPCA for comparison.

