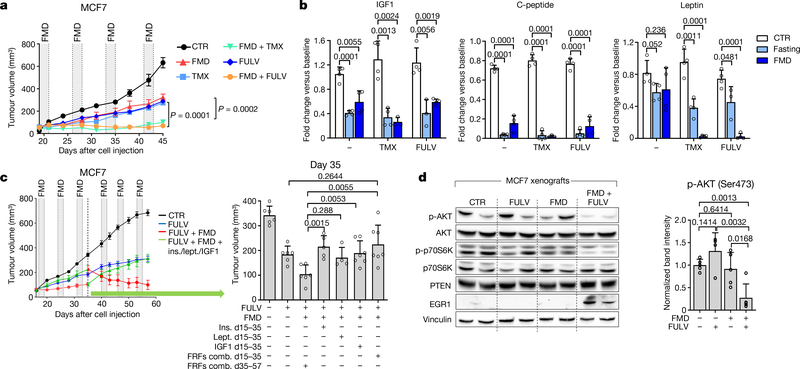
Fig. 1 |. Fasting or FMD potentiates the activity of ET in HR+ BC by reducing circulating growth-promoting factors.
a, Growth of MCF7 xenografts in 6–8-week-old female BALB/c nude mice treated with ad libitum diet (control, CTR; n = 6), weekly 48-h FMD (n = 6), tamoxifen (TMX; n = 6), fulvestrant (FULV; n = 8), or combined TMX + FMD (n = 8) or FULV + FMD (n = 10). b, Changes in serum IGF1, C-peptide and leptin concentration in female 6–8-week-old BALB/c nude mice treated with fasting or FMD (or ad libitum diet) with or without TMX or FULV. Serum was collected at the end of the fast or FMD. c, Six-to-eight-week-old female BALB/c nude mice were inoculated with MCF7 cells; when tumours became palpable, mice were randomized to be treated with ad libitum diet (n = 6), FULV (n = 6), FULV plus weekly FMD (n = 6), FULV plus weekly FMD plus intraperitoneal (i.p.) insulin (ins.; n = 5), IGF1 (n = 5), leptin (lept.; n = 5) or combined insulin + IGF1 + leptin (FRFs comb.; n = 7). At day 35 (crossover), FRF administration was withdrawn, whereas it was started in mice that had received only FULV + FMD. Left, MCF7 xenograft growth in response to ad libitum diet, fulvestrant, fulvestrant plus FMD, or fulvestrant, FMD and re-addition of the three FRFs (for the first 35 days or starting from day 35). Right, volume of MCF7 xenografts in response to the different treatments at day 35. d, Six-to-eight-week-old female BALB/c nude mice were inoculated with MCF7 cells. When tumours became palpable, mice were randomized to be treated with ad libitum diet, FULV, 48-h FMD or FULV + FMD. Mice were killed at the end of the fourth FMD cycle. Left, phosphorylated (p-) (Ser473 for AKT; Thr389 for p70S6K) and total AKT and p70S6K, EGR1, PTEN and vinculin (on the same gel) in the tumours were detected by immunoblotting. Right, phosphorylated AKT bands were quantified and normalized to total AKT (data points are biological replicates). For gel source data, see Supplementary Fig. 1. n, number of tumours per treatment group. Data are mean ± s.e.m. (a, c) or s.d. (b, d, right). a, P values determined by two-way ANOVA with Bonferroni post-hoc test and two-tailed Student’s t-test (day 45); b–d, by two-tailed Student’s t-test.

