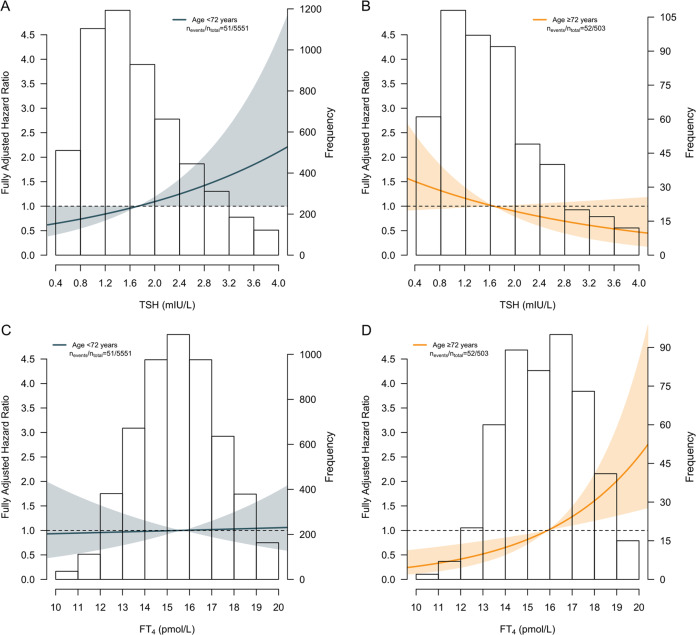
Fig. 2.
Graphical representation of the survival estimates of thyrotropin and thyroxine for cardiovascular mortality stratified by age. a shows the impact of thyrotropin on the risk of cardiovascular mortality in participants younger than 72 years and b in participants aged 72 years or older. c shows the impact of FT4 on the risk of cardiovascular mortality in participants younger than 72 years and d in participants aged 72 years or older. The lines represent the risk of cardiovascular mortality. The areas about the lines represent the 95% confidence interval associated with the line. The median thyrotropin and FT4 concentration was chosen as a reference in the upper two and lower two panels, respectively. The distribution of thyrotropin and FT4 in both age strata is depicted by the histogram in the background. Cutoff values for the age strata were established through dichotomization of the cohort by the median age in participants who had succumbed to cardiovascular disease, to obtain an equal amount of events per stratum. FT4 thyroxine, TSH thyrotropin

