Fig. 4.
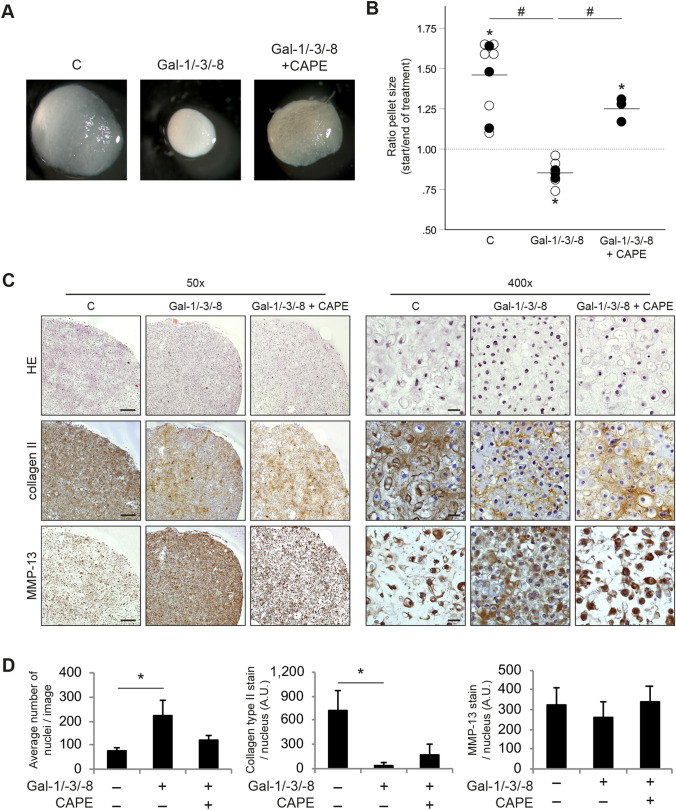
Extracellular matrix degeneration in OA chondrocytes pellets after treatment with the galectin mixture Gal-1/-3/-8 and CAPE. a OA chondrocyte pellets from five donors were cultured for 3 weeks followed by 2 weeks of treatment with Gal-1/-3/-8 (5/1/5 µg/ml) in the absence or presence of CAPE (40 µM). Untreated pellets were used as control (c). Shown are macroscopic pictures of OA chondrocyte pellets from one representative patient. b Shown is the ratio of the pellet size between start (day 21) and end of treatment (day 35). Pellets were treated with Gal-1/-3/-8 (n = 7 patients), or with Gal-1/-3/-8 + CAPE (n = 3 patients). Control pellets were left untreated (n = 9 patients). Each circle represents one patient. Full circles illustrate the three cell populations that were cultured under all three conditions. Lines indicate the mean values of each group. The dashed line marks the ratio of 1, indicating a hypothetical stable pellet size during treatment. Asterisks indicate statistical significant difference of a group compared to a value of 1 (“stable size”; two-sided t-test, p < 0.05). Hash signs indicate significant differences between groups (ANOVA with Tukey post hoc test, p < 0.05). c Consecutive histological sections of OA chondrocyte pellets from three donors were stained with HE, or with anti-collagen type II and anti-MMP-13 antibodies (3 technical replicates; left panel, ×50 magnification; right panel, ×400 magnification). Shown is a series of stainings of pellets from one representative patient. Scale bars (exemplarily depicted in images of untreated control pellets): 200 µm (×50), 20 µm (×400). d Bar charts show the average number of nuclei (left graph), signal intensity of collagen type II-staining normalized to the number of nuclei (middle graph), and signal intensity of MMP-13 staining normalized to the number of nuclei (right graph) across three patients (5 technical replicates). Significant differences between the groups are indicated with asterisks (*p < 0.05, n = 3, Friedman test)

